Analysis
? Check our tutorial or report bugs here.
- Please use Chrome, FireFox, Edge and Safari web browser for best performance.
- Please enable Javascript in your browser and do not use Internet Explorer.
- Please make sure that you are using the correct input data.
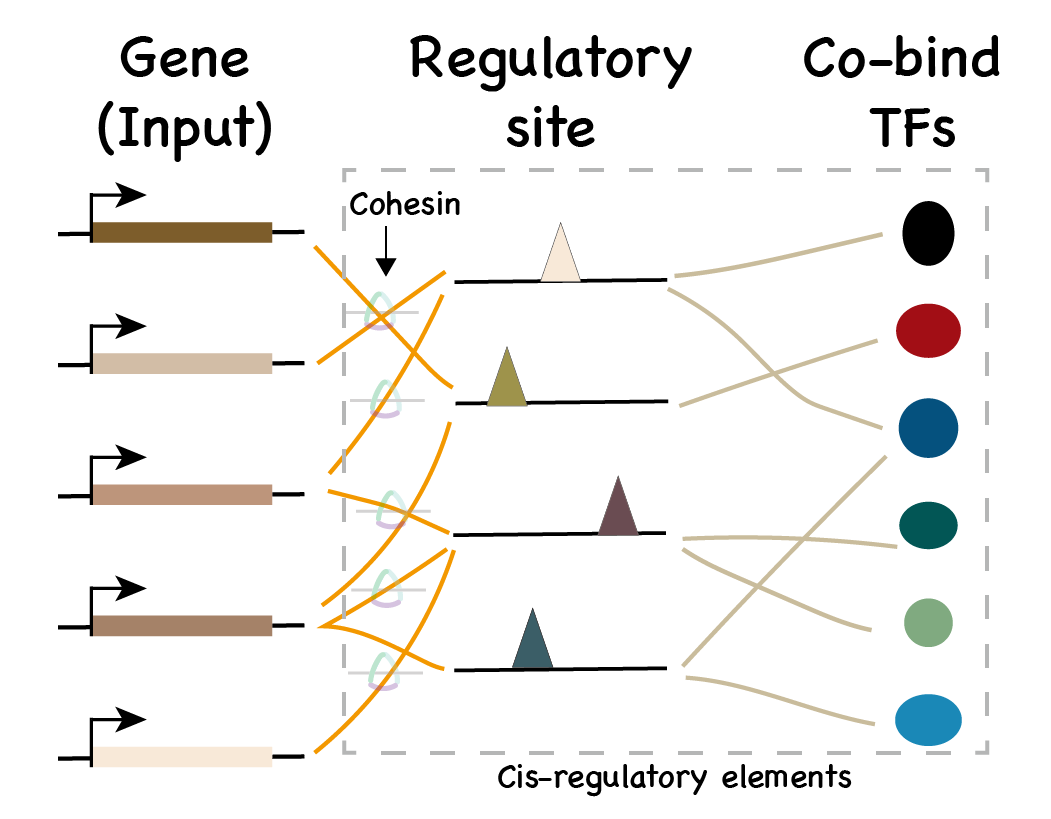
Predict regulatory sites
- Input: A list of gene name (HGNC symbol).
- Output: Regions of potential regulatory elements.
Start
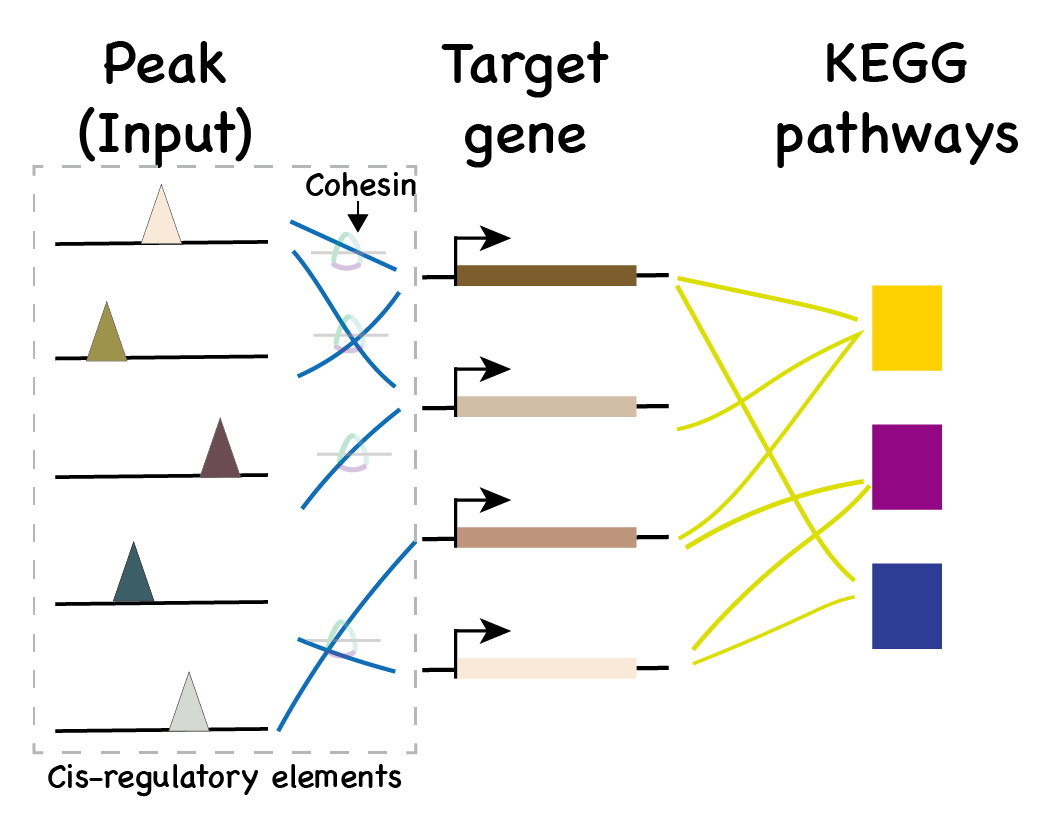
Predict target gene
- Input: List of genomic regions.
- Output: Possible target genes.
Start
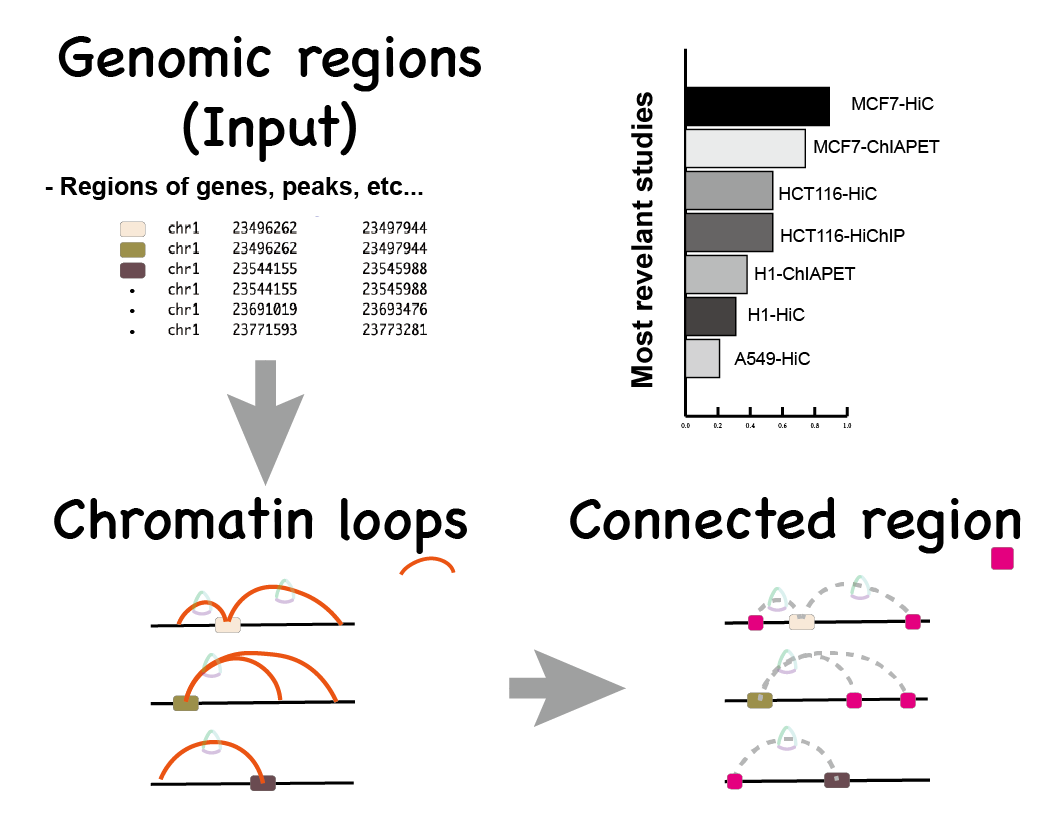
Loop discovery
- Input: Genomic regions.
- Output: Related chromatin loops.
Start
Look for regulatory sites
Matched genes with regulatory cohesin.
To achieve better visualization
- Cohesin peaks are merged (50kb)
- Only top 10 (number of pairs) gene-cohesin pairs are shown
- Only top 10 (number of TFs) transcriptional clusters are shown
Download the .csv file to check full list of matches
Look for target gene
Matched cohesin peaks,
of which targeted genes.
To achieve better visualization
- Transcription factor are shown as family
Download the .csv file to check detailed matches
Discover loops based on genomic regions
Detected regions from input.
Selected cell type: .
Matched chromatin loops derived from studies.
(one region may overlap several loops)
Download the .csv file to check detailed matches.