Documents and tutorial
This page provides the complete tutorial for CohesinDB.
The main contents of CohesinDB include three types of cohesin objects (i.e., cohesin binding sites, cohesin related chromatin loops and cohesin related cis-regulatory modules) and the processed data involved (e.g., bigwig files for ChIP-seq.):
- Cohesin objects: Browse, Analyze, Statistic, Download
- NGS data involved: Visualize, Data, Statistic
- Others: Home, Documents
Additional information 1: You can jump to the section you are interested in by selecting the panel on the right -->>
Additional information 2: Documentation on the code and maintenance of CohesinDB can be found here. Notify datasets to CohesinDB can be found here
Additional information 3: Please use this page to contact us for any bugs or problems (or contact wangjk[AT]m.u-tokyo.ac.jp).
Overview
Cohesin is a multifunctional protein complex for transcriptional regulation and chromatin organization. Cohesin is present in almost all cis-regulatory modules and is involved in a variety of human diseases. Research advances in the last decade have demonstrated that the function of cohesin varies greatly depending on the specific details of chromatin loci (i.e., ‘context-specific’). Even though next-generation sequencing technologies have provided a wealth of information on different aspects of cohesin, exploring the massive cohesin datasets is not straightforward. Here, we present CohesinDB, a comprehensive multi-omics cohesin database for human cells. CohesinDB collected 2,043 samples from 530 studies involving 176 cell types. By integrating large-scale epigenomics, transcriptomics and 3D genomics data, CohesinDB provides three types of cohesin objects: 751,590 cohesin binding sites, 957,868 cohesin-mediated chromatin loops and 2,229,500 cohesin regulated cis-regulatory modules. Each cohesin object was comprehensively annotated, constituting an atlas of cohesin, chromatin structure and gene regulation. CohesinDB provides a user-friendly interface for searching, browsing, analyzing, visualizing, and downloading. The multi-omics information integrated in CohesinDB will contribute a valuable resource for all researchers studying transcriptional regulation and chromatin organization.
Mapping genome reference: hg38
Website URL: https://cohesindb.iqb.u-tokyo.ac.jp/ (If not available, try http instead of https)
Last website update: 2022, August, 01
Current version: v1.0.10
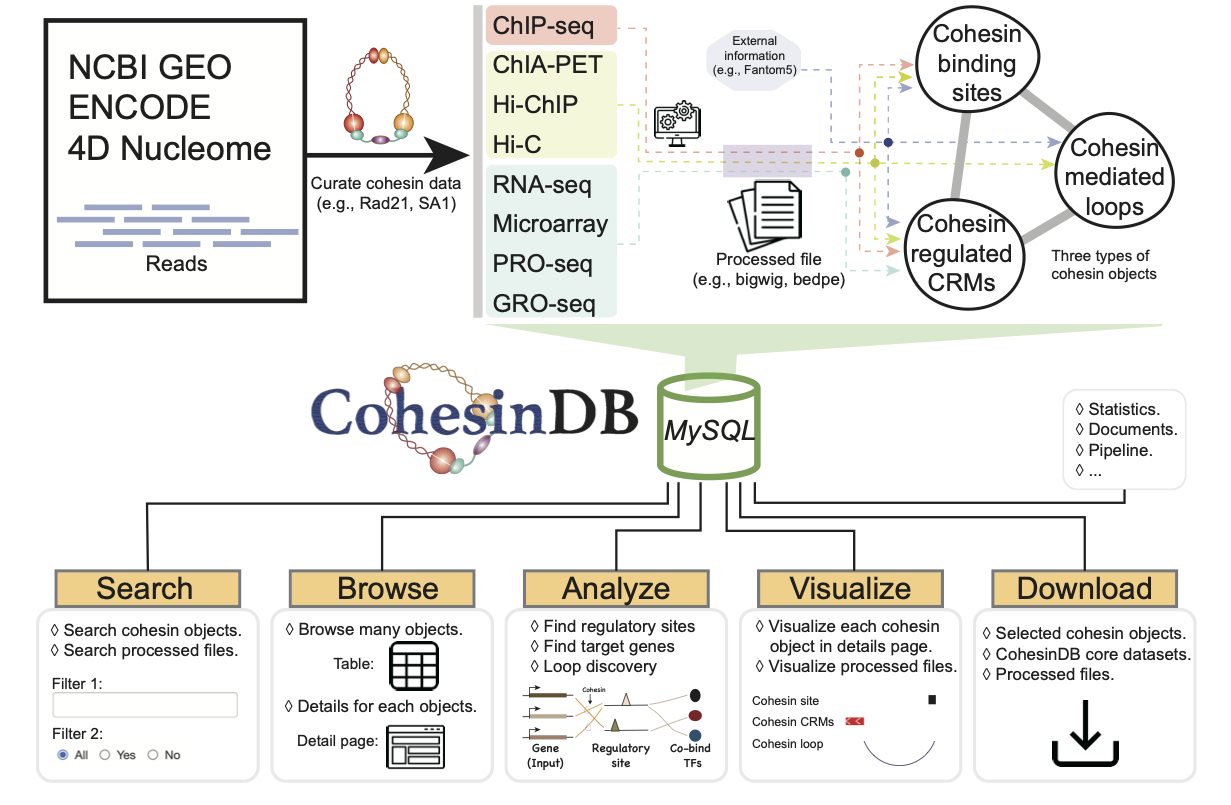
Important information 1: Flowchart of the construction of CohesinDB:
CohesinDB provides the most comprehensive database for cohesin in human cells. We collected and manually curated large amount of NGS data related to cohesin, from GEO, ENCODE and 4DN databases. The three types of cohesin objects are used to make Browse, Analyze, Statistic, Download pages. In detail, the cohesin binding sites are identified from ChIP-seq; The cohesin-mediated chromatin loops are identified from Hi-C, Hi-ChIP and ChIA-PET; For the cohesin-related CRMs/genes, CohesinDB considers not only cohesin-knockdown DEGs (differential expressed genes) from RNA-seq, Microarray, PRO-seq, GRO-seq, but also the cohesin loops from ChIP-seq, ChIA-PET, Hi-C, Hi-ChIP. In addition, cohesin provides all "processed files" in Data and Visualize sections, which facilitate researchers to re-use these cohesin-related datasets. All these integrated resources above are managed by a MySQL database. For the construction of website, CohesinDB uses Python and Django as the main backend language, JQuery, Bootstrap, Javascript, HTML/CSS as the main frontend language. CohesinDB does not require any registration or login. The web server, web domain and SSL certificate of CohesinDB are provided by an academic institution, and we anticipate that CohesinDB will be maintained for a long time.
Important information 2: Why current CohesinDB focus on human cells:
While the current version of CohesinDB aims to integrate multiomics information in various types of human cells, other studies have also revealed the key role of cohesin in other species. Of note, simply collecting cohesin binding sites for many species is not the purpose of CohesinDB, whereas this kind of information can be found in some general ChIP-seq databases, such as ReMap and ChIP-Atlas. Currently, the challenge in constructing comprehensive multiomics cohesin database for multiple species remains the amount of available data. For example, the ENCODE project provides 25 ChIP-seq and 31 ChIA-PET datasets targeting Rad21 for human cells, but only two ChIP-seq and zero ChIA-PET datasets for mouse cells; There are 71 publicly available studies that can be used to define cohesin-DEGs in human cells, but only one study is available for Drosophila. With the increasing number of NGS datasets, in the future, CohesinDB will be updated to support multiple species. In addition, cross species analysis might be important in the future versions of CohesinDB.
Browse
Browse page provides three types of cohesin objects:
- Cohesin binding sites
- The combined cohesin binding sites with detailed annotations.
- Cohesin mediated interactions
- Chromatin loops that are mediated by cohesin.
- Cohesin related CRMs / genes
- Cohesin peak-to-gene pairs with annotations of epigenomics and 3D genomics (double-evidenced)
You can choose the desired section by select the dropdown list on Browse
Browse cohesin binding sites
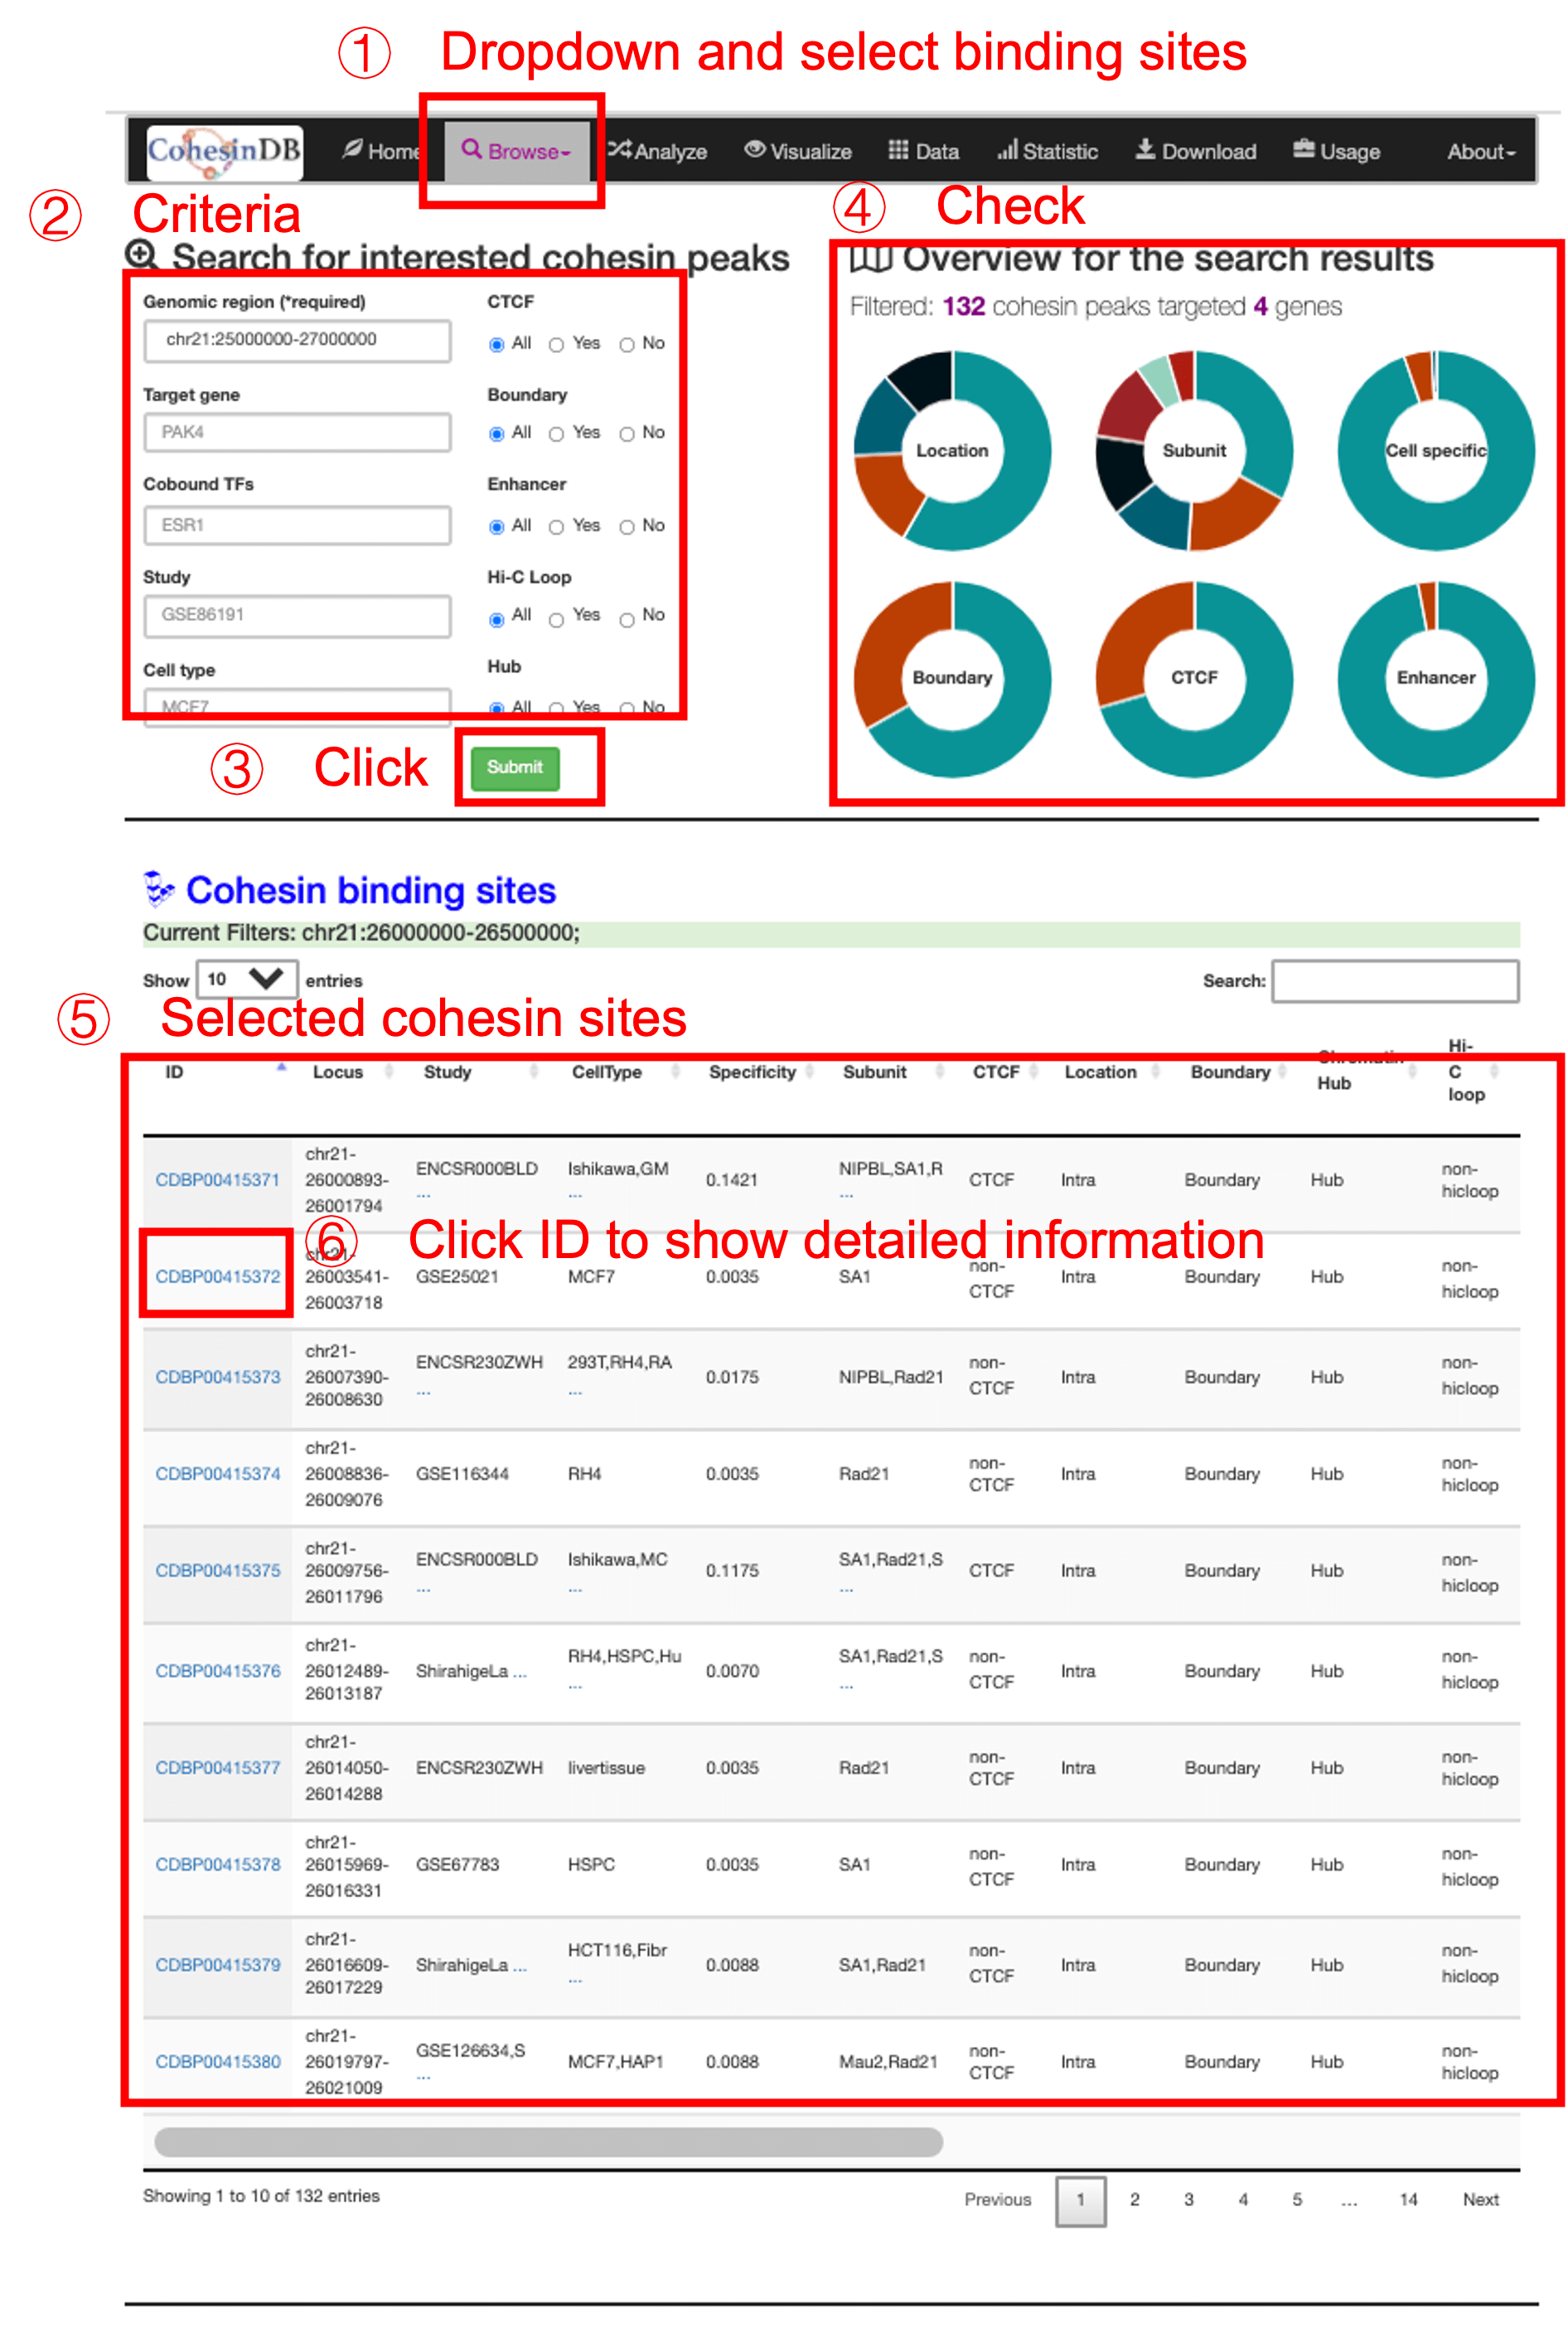
The universal cohesin binding sites are combined from the cohesin ChIP-seq data in CohesinDB. High quality ChIP-seq samples with >1000 peak numbers are used. To obtain the high confidence peaks, cohesin sites that are detected in >= 2 samples are retained. To avoid the clustered small peaks, peaks whose distance < 200bp are merged. overall, there are 751,590 cohesin peaks are included in CohesinDB.
A typical usage of browsing cohesin binding sites are shown as following screenshot. Briefly, (1) you enter this cohesin peak page by click on the dropdown list. (2) Then you can enter filters to define the criteria for cohesin sites. (3) After clicking the submit button, the right panel (4) shows the overview of search results. The table (5) gives the major information of the chosen cohesin peak list. You can check the information and annotations in this table, or enter the details page via click on the CDB ID (6) You can download the table results as a csv or Excel format.
* The users are expected to use enough filters, otherwise the webpage showing thousands of objects would be too heavy and slow.
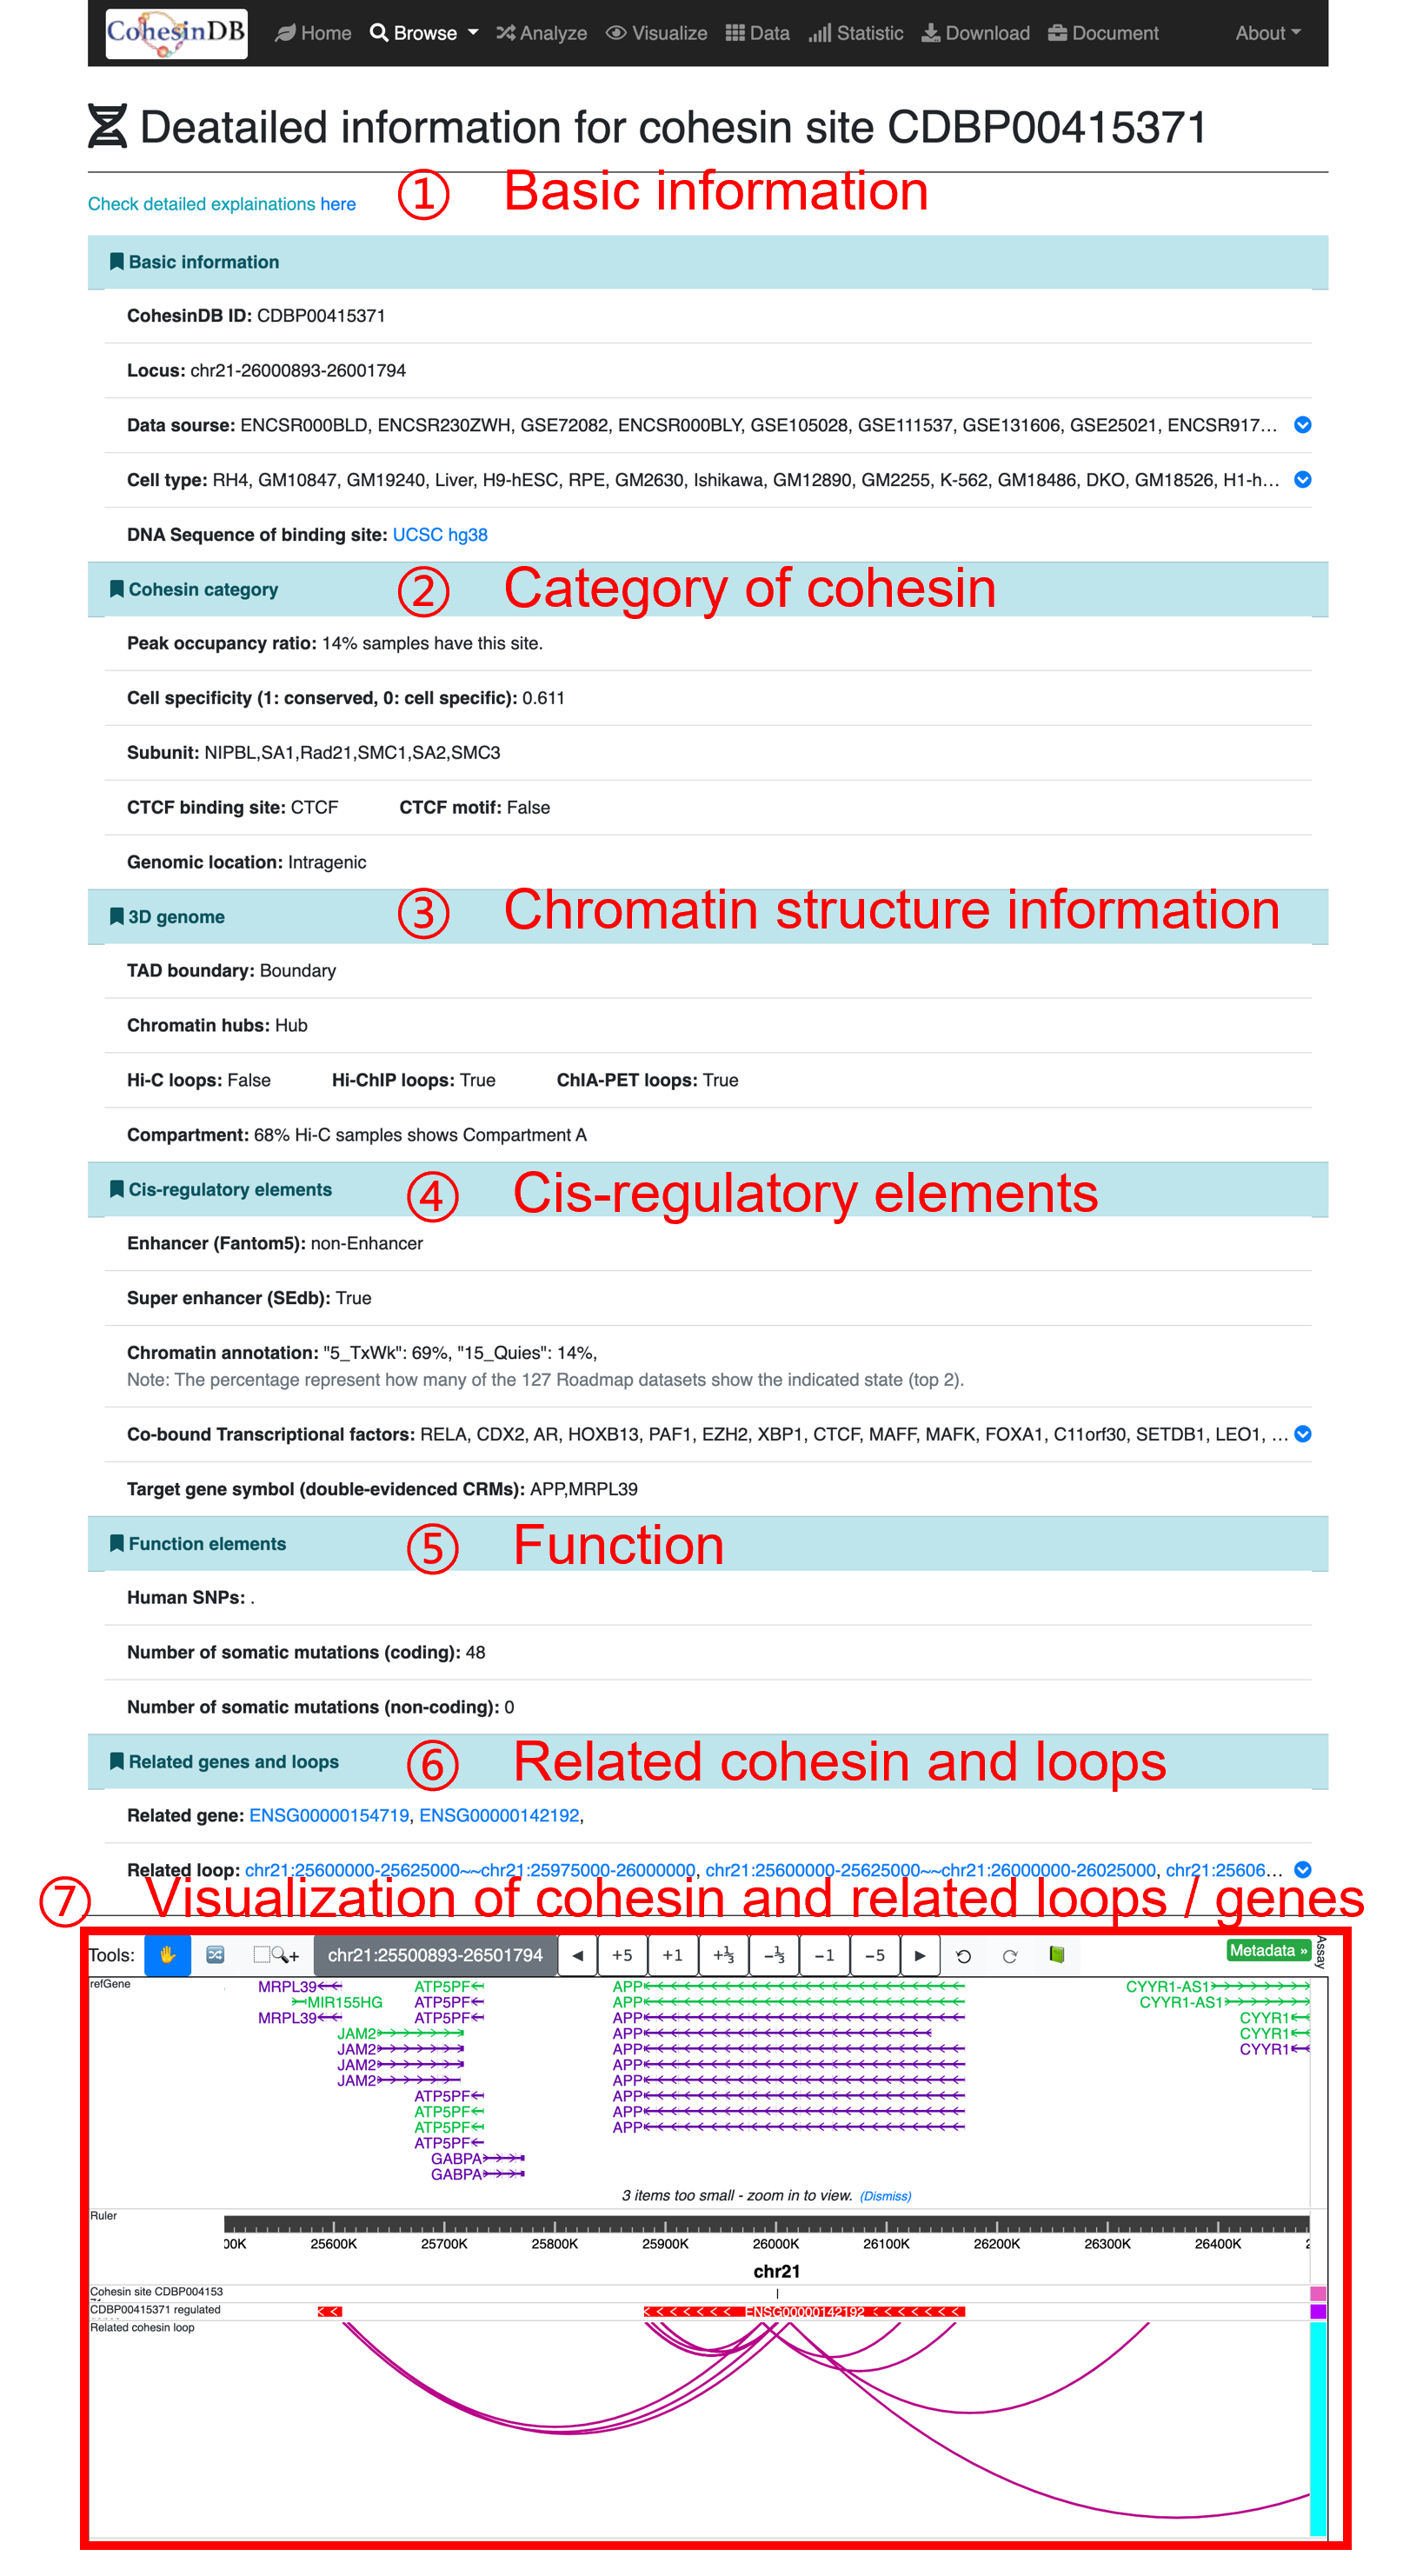
By click on the CDB ID, you can enter the details pages for each cohesin sites. You can share the URL of detailed pages to others such as collaborators. This page provides comprehensive annotation for each sites, including:
Basic Information
Cohesin category
3D genome
Cis-regulatory elements
Function elements
Related genes and loops
Visualization
CohesinDB ID: A unique ID for each peaks start with "CDBP". You can share the web page for each cohesin sites by https://cohesindb.iqb.u-tokyo.ac.jp/browsepeak/eachpeak/CDBP{ID}/
Locus: The genomic locus of selected cohesin sites (hg38 human genome reference).
Data source: The studies that are used to identify this cohesin sites. You can access the data by the ID from Encode, 4DN or GEO.
Cell type: The cell types that are used to identify this cohesin sites.
Sequence: The nucleotide sequence in hg38 reference genome.
Peak occupancy ratio: Percentage of samples containing a certain cohesin site)
Cell specificity: A score that measures the cell specificity. A higher value (~1) represents the conserved sites, while a lower value (~0) represents the cell-specific sites.
Subunit: The involved cohesin subunits.
Whether CTCF: Whether this cohesin site have overlaps with CTCF.
CTCF motif: Whether this cohesin site have CTCF motif.
Genomic location: (Ensembl) Intra: Intragenic; Inter: Intergenic; TSS: transcription start sites; TES: transcription end sites.
TAD boundary: Whether this cohesin site overlap with TAD boundary.
Chromatin hubs: Whether this cohesin site overlap with chromatin hubs.
Hi-C loops: Whether this cohesin site overlap with Hi-C loops.
Hi-ChIP loops: Whether this cohesin site overlap with Hi-ChIP loops.
ChIA-PET loops: Whether this cohesin site overlap with ChIA-PET loops.
Compartment: Percentage of Hi-C samples shows Compartment A.
Enhancer: Whether this cohesin site overlap with Enhancers (defined in Fantom5 database).
Super Enhancer: Whether this cohesin site overlap with Super Enhancers (defined in SEdb database).
Chromatin states: The chromatin annotation in Roadmap ChromHMM project.
Co-binding TFs: The possible transcription factors that are located at this cohesin sites. TFs information is from ReMAP2020 database
Target gene: The candidate cohesin regulated genes that are evidenced by both "cohesin DEGs" and "cohesin loops".
SNPs: The SNPs (from GWAS catalog) on this cohesin sites. "." represent no SNPs on this site.
Somatic coding mutations: Number of mutation events that are defined in COSMIC database.
Somatic noncoding mutations: Number of noncoding mutation events that are defined in COSMIC database.
Related gene: The gene ID of cohesin regulated genes. This is the same with "Target gene" but with a link. You can click to see the details of involved genes.
Related gene: Chromatin loops that are located in this cohesin site.
This visualization is based on WashU Epigenome Browser API. You can see the selected cohesin site, related loops and related genes here. If you are interested in more details, please check Related gene and Related loop
Browse cohesin-mediated loops
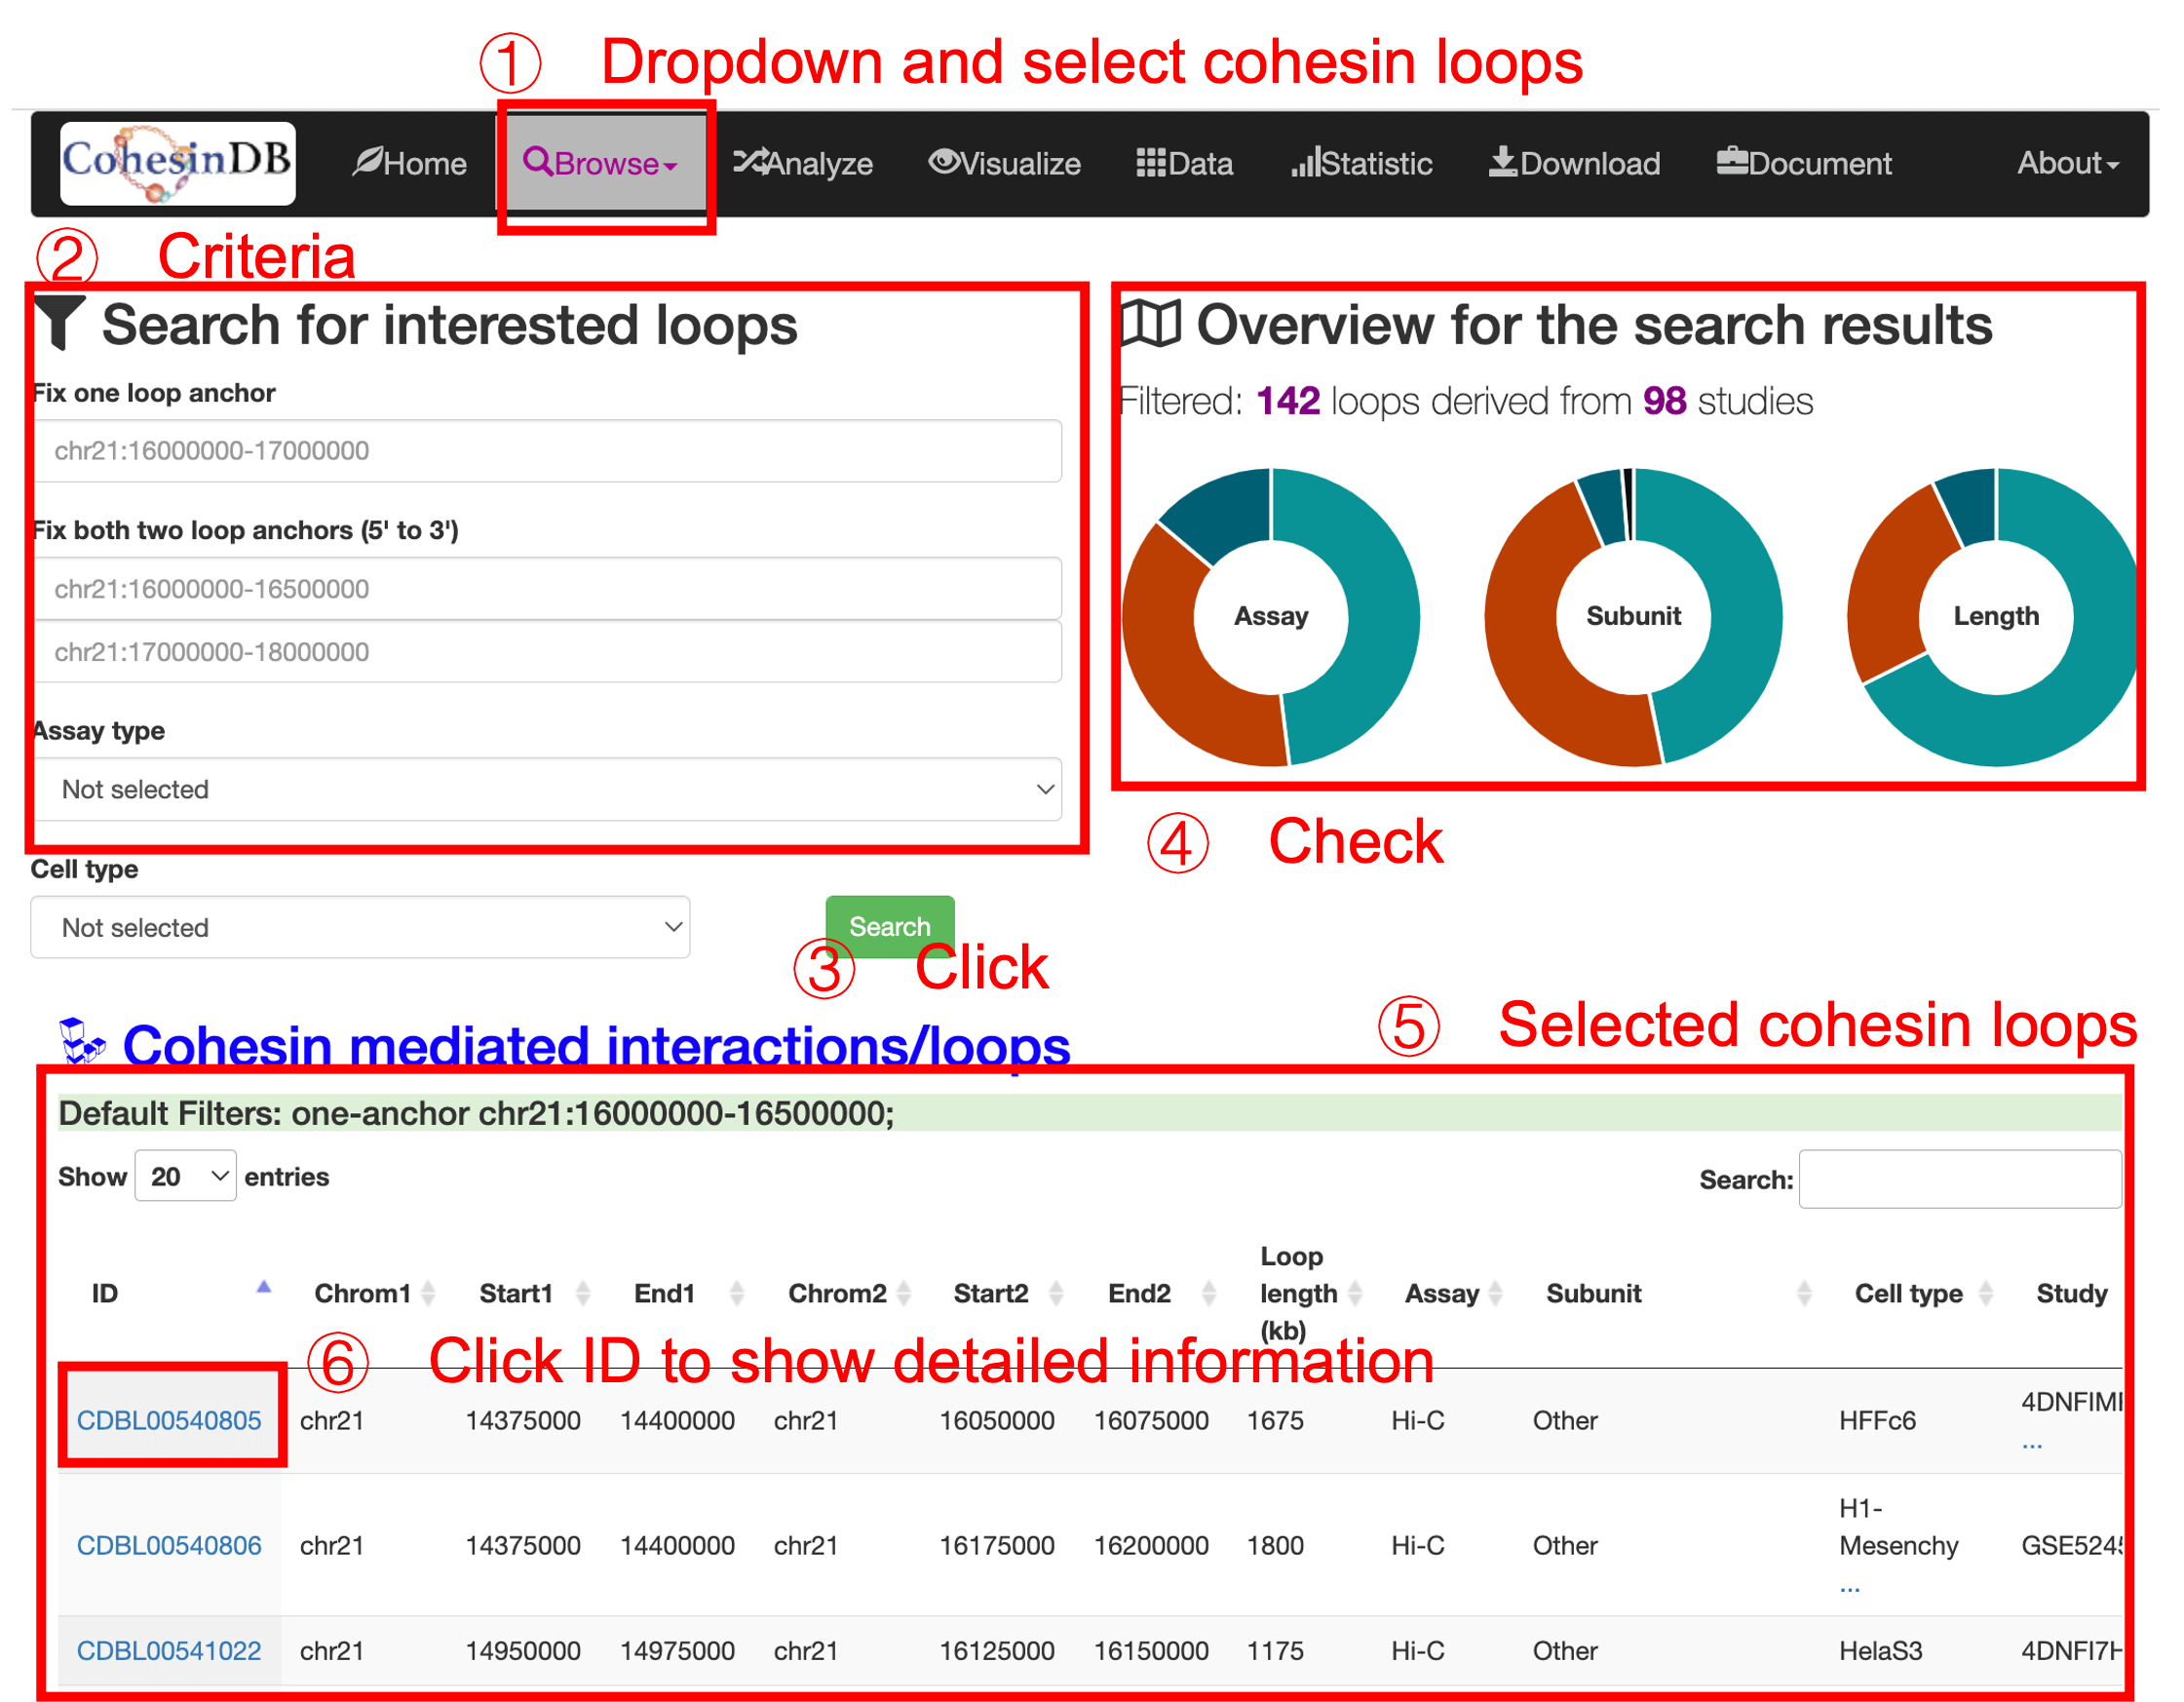
The cohesin-mediated loops are identified from 119 cohesin ChIA-PET data, 42 cohesin Hi-ChIP data and 385 Hi-C data. Overall, CohesinDB includes ~1 million (957,867) chromatin loops. Similar to 'browse cohesin sites', to browse cohesin-mediated loops: (1) you enter this cohesin loop page by click the dropdown list. (2) Then you can enter filters to define the criterias for cohesin loops. (3) After clicking the submit button, the right panel (4) shows the overview of search results. The table (5) gives the main information of the selected loops. You can check the information and annotations in this table, or enter the details page via click on the CDB ID (6) You can download the table results as a csv or Excel format.
* Too few filters will make this webpage heavy.
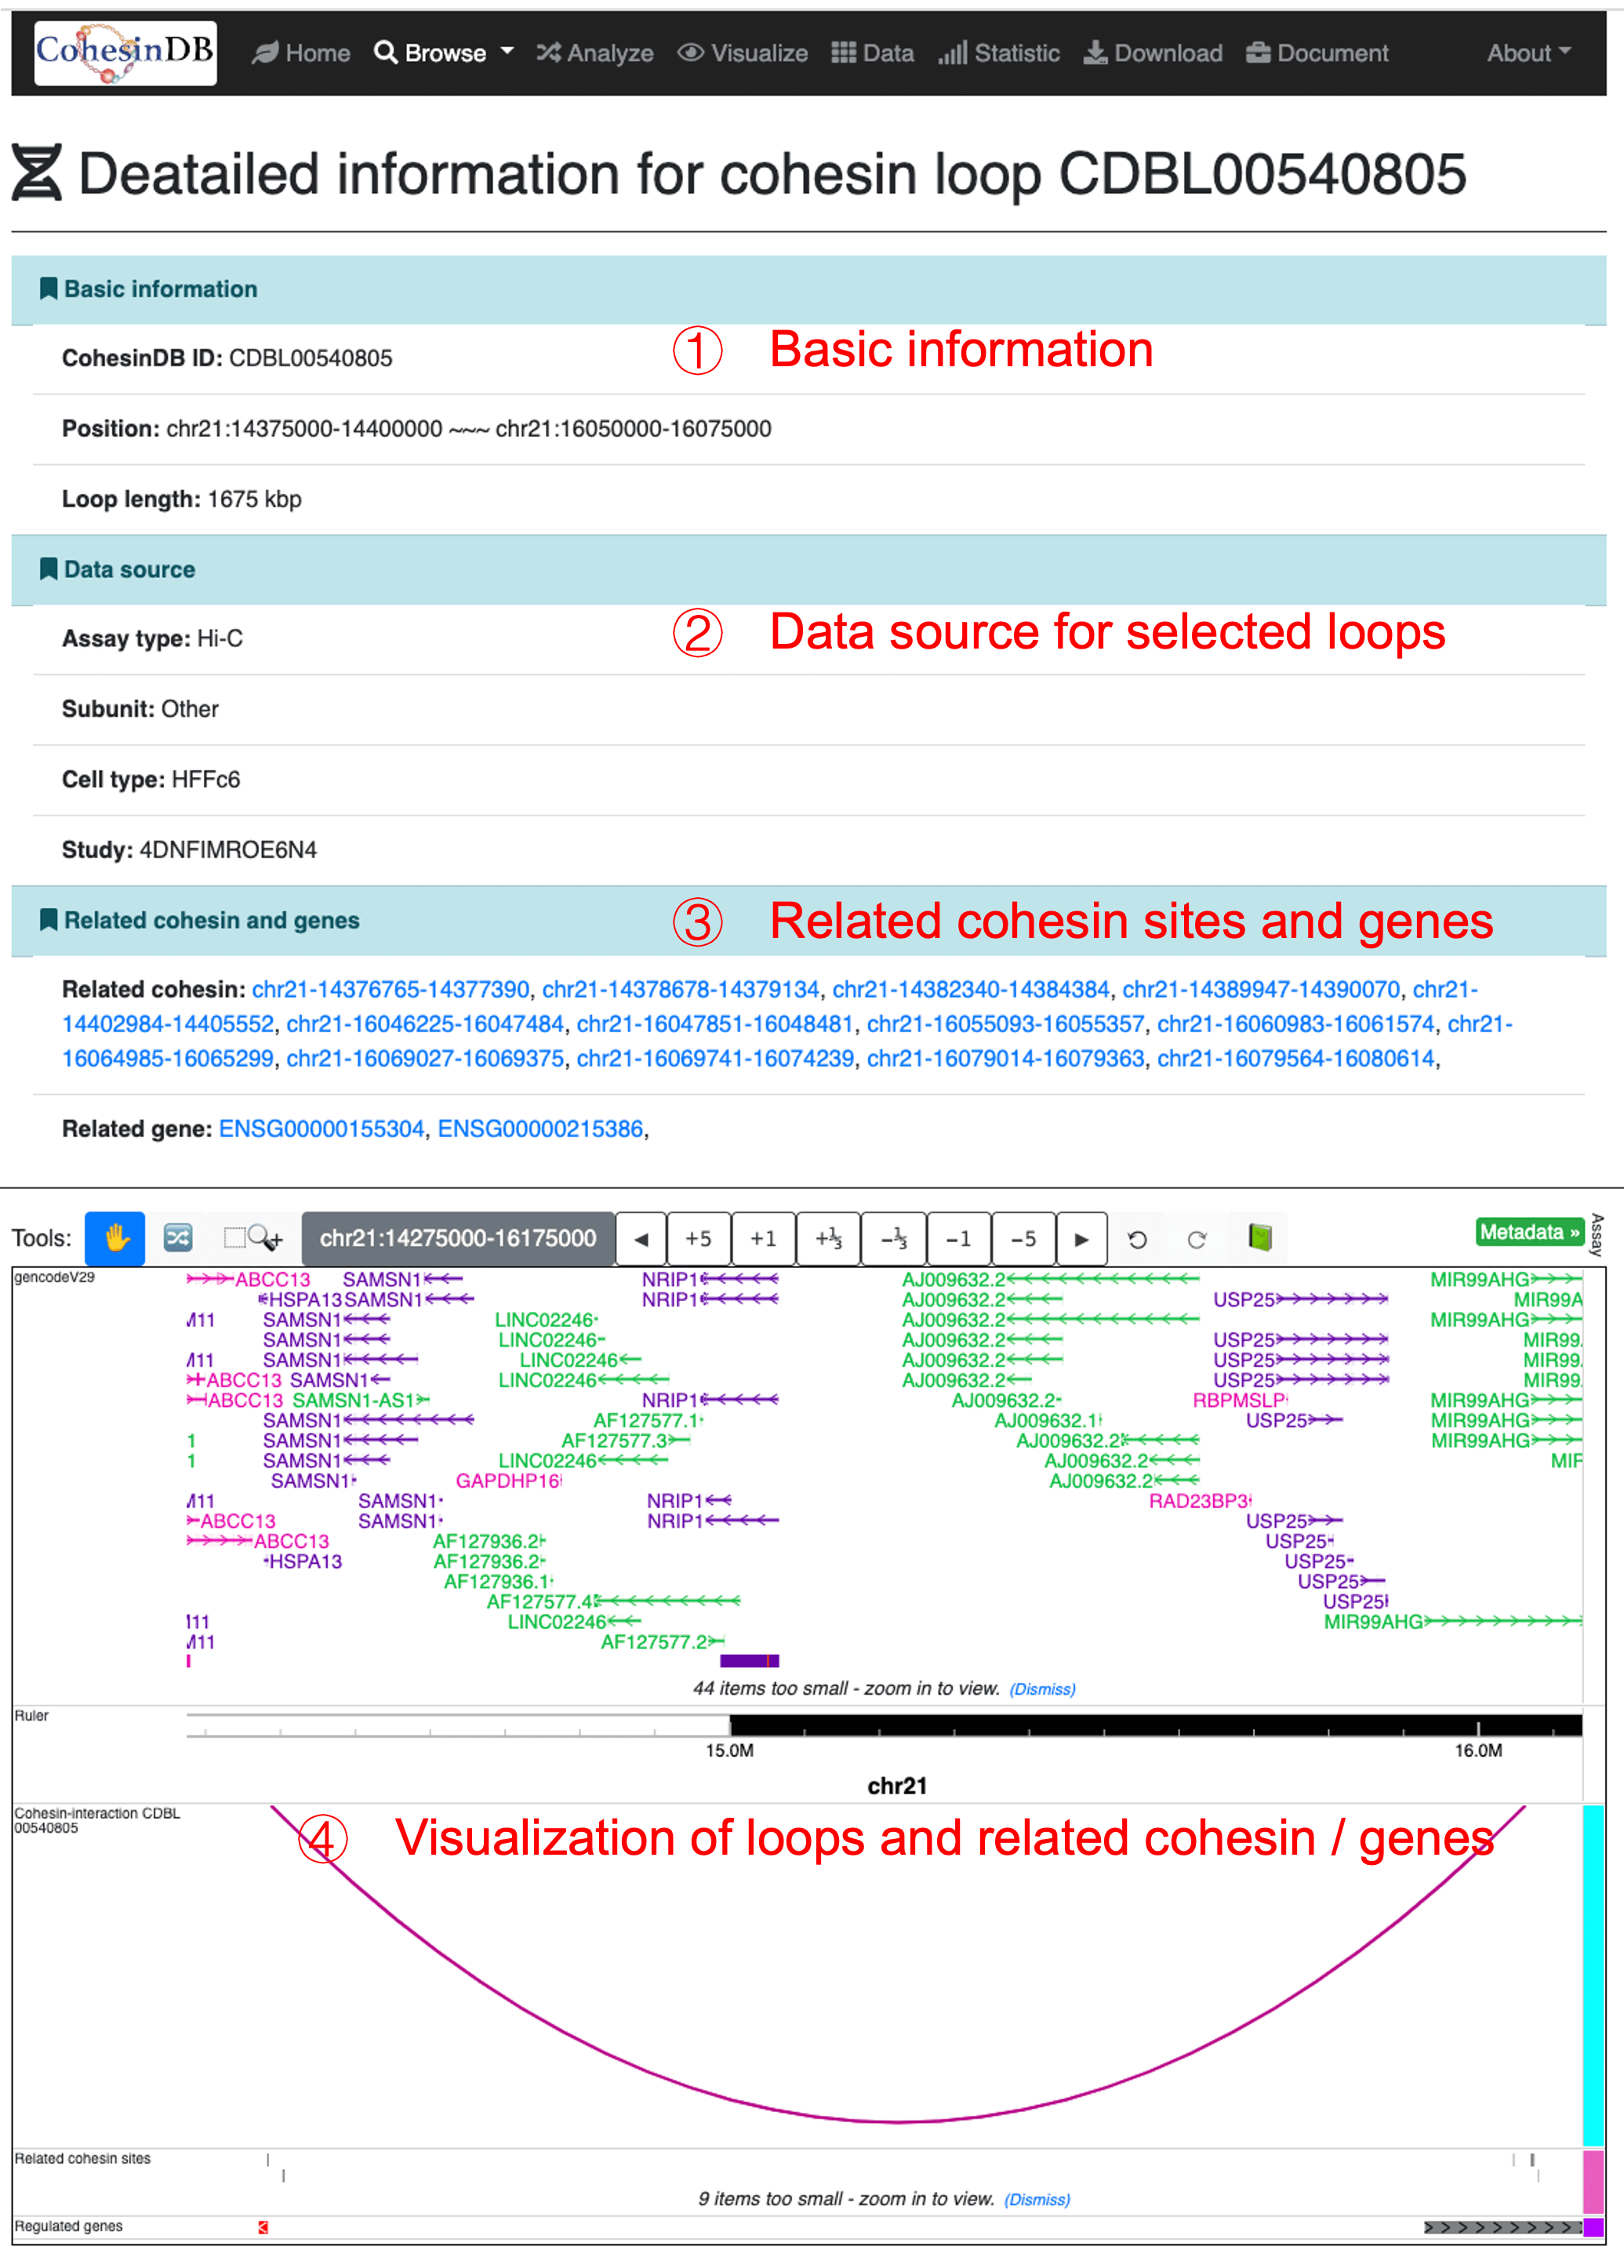
By click on the CDB ID (CDBL*), you can enter the details pages for each cohesin loops. You can share the URL of detailed pages to others such as collaborators The detailed page provides annotations including:
Basic information
Data source
Related cohesin and genes
Visualization
A unique identify; Genomic position of the loop; Loop length.
The assay type (Hi-C, Hi-ChIP or ChIA-PET); Involved cohesin subunit; Cell types of the involved samples; Related studies.
Cohesin sites and genes that overlap with the selected loop.
The plot of selected loop and related cohesin sites and related genes. You can drag to move the coordinates. This section is based on the embedding of WashU Epigenome Browser
Browse cohesin-regulated genes
This page is for cohesin-regulated genes. CohesinDB considered two types of evidence to obtain cohesin-gene pairs.
- Differential expressed genes identified from Transcriptomic data (e.g. RNA-seq, cohesin-knockdown compare with control). Only DEGs identified in ≥ 2 studies are used. Cohesin sites less than 2mb from DEGs are considered as regulatory cohesin.
- Chromatin loops that connected cohesin sites to gene promoters.
Overall, CohesinDB contains 2,229,500 double-evidenced cohesin-gene pairs.
The user interface is the same with cohesin sites and loops. (1) You enter this cohesin-mediated genes page by click the dropdown list. (2) Then you can enter filters to define the criteria for genes. (3) After clicking the submit button, the right panel (4) shows the overview of search results. The table (5) gives the main information of the selected genes. You can check the information and annotations in this table, or enter the details page via click on the CDB ID (6) You can download the table results as a csv or Excel format.
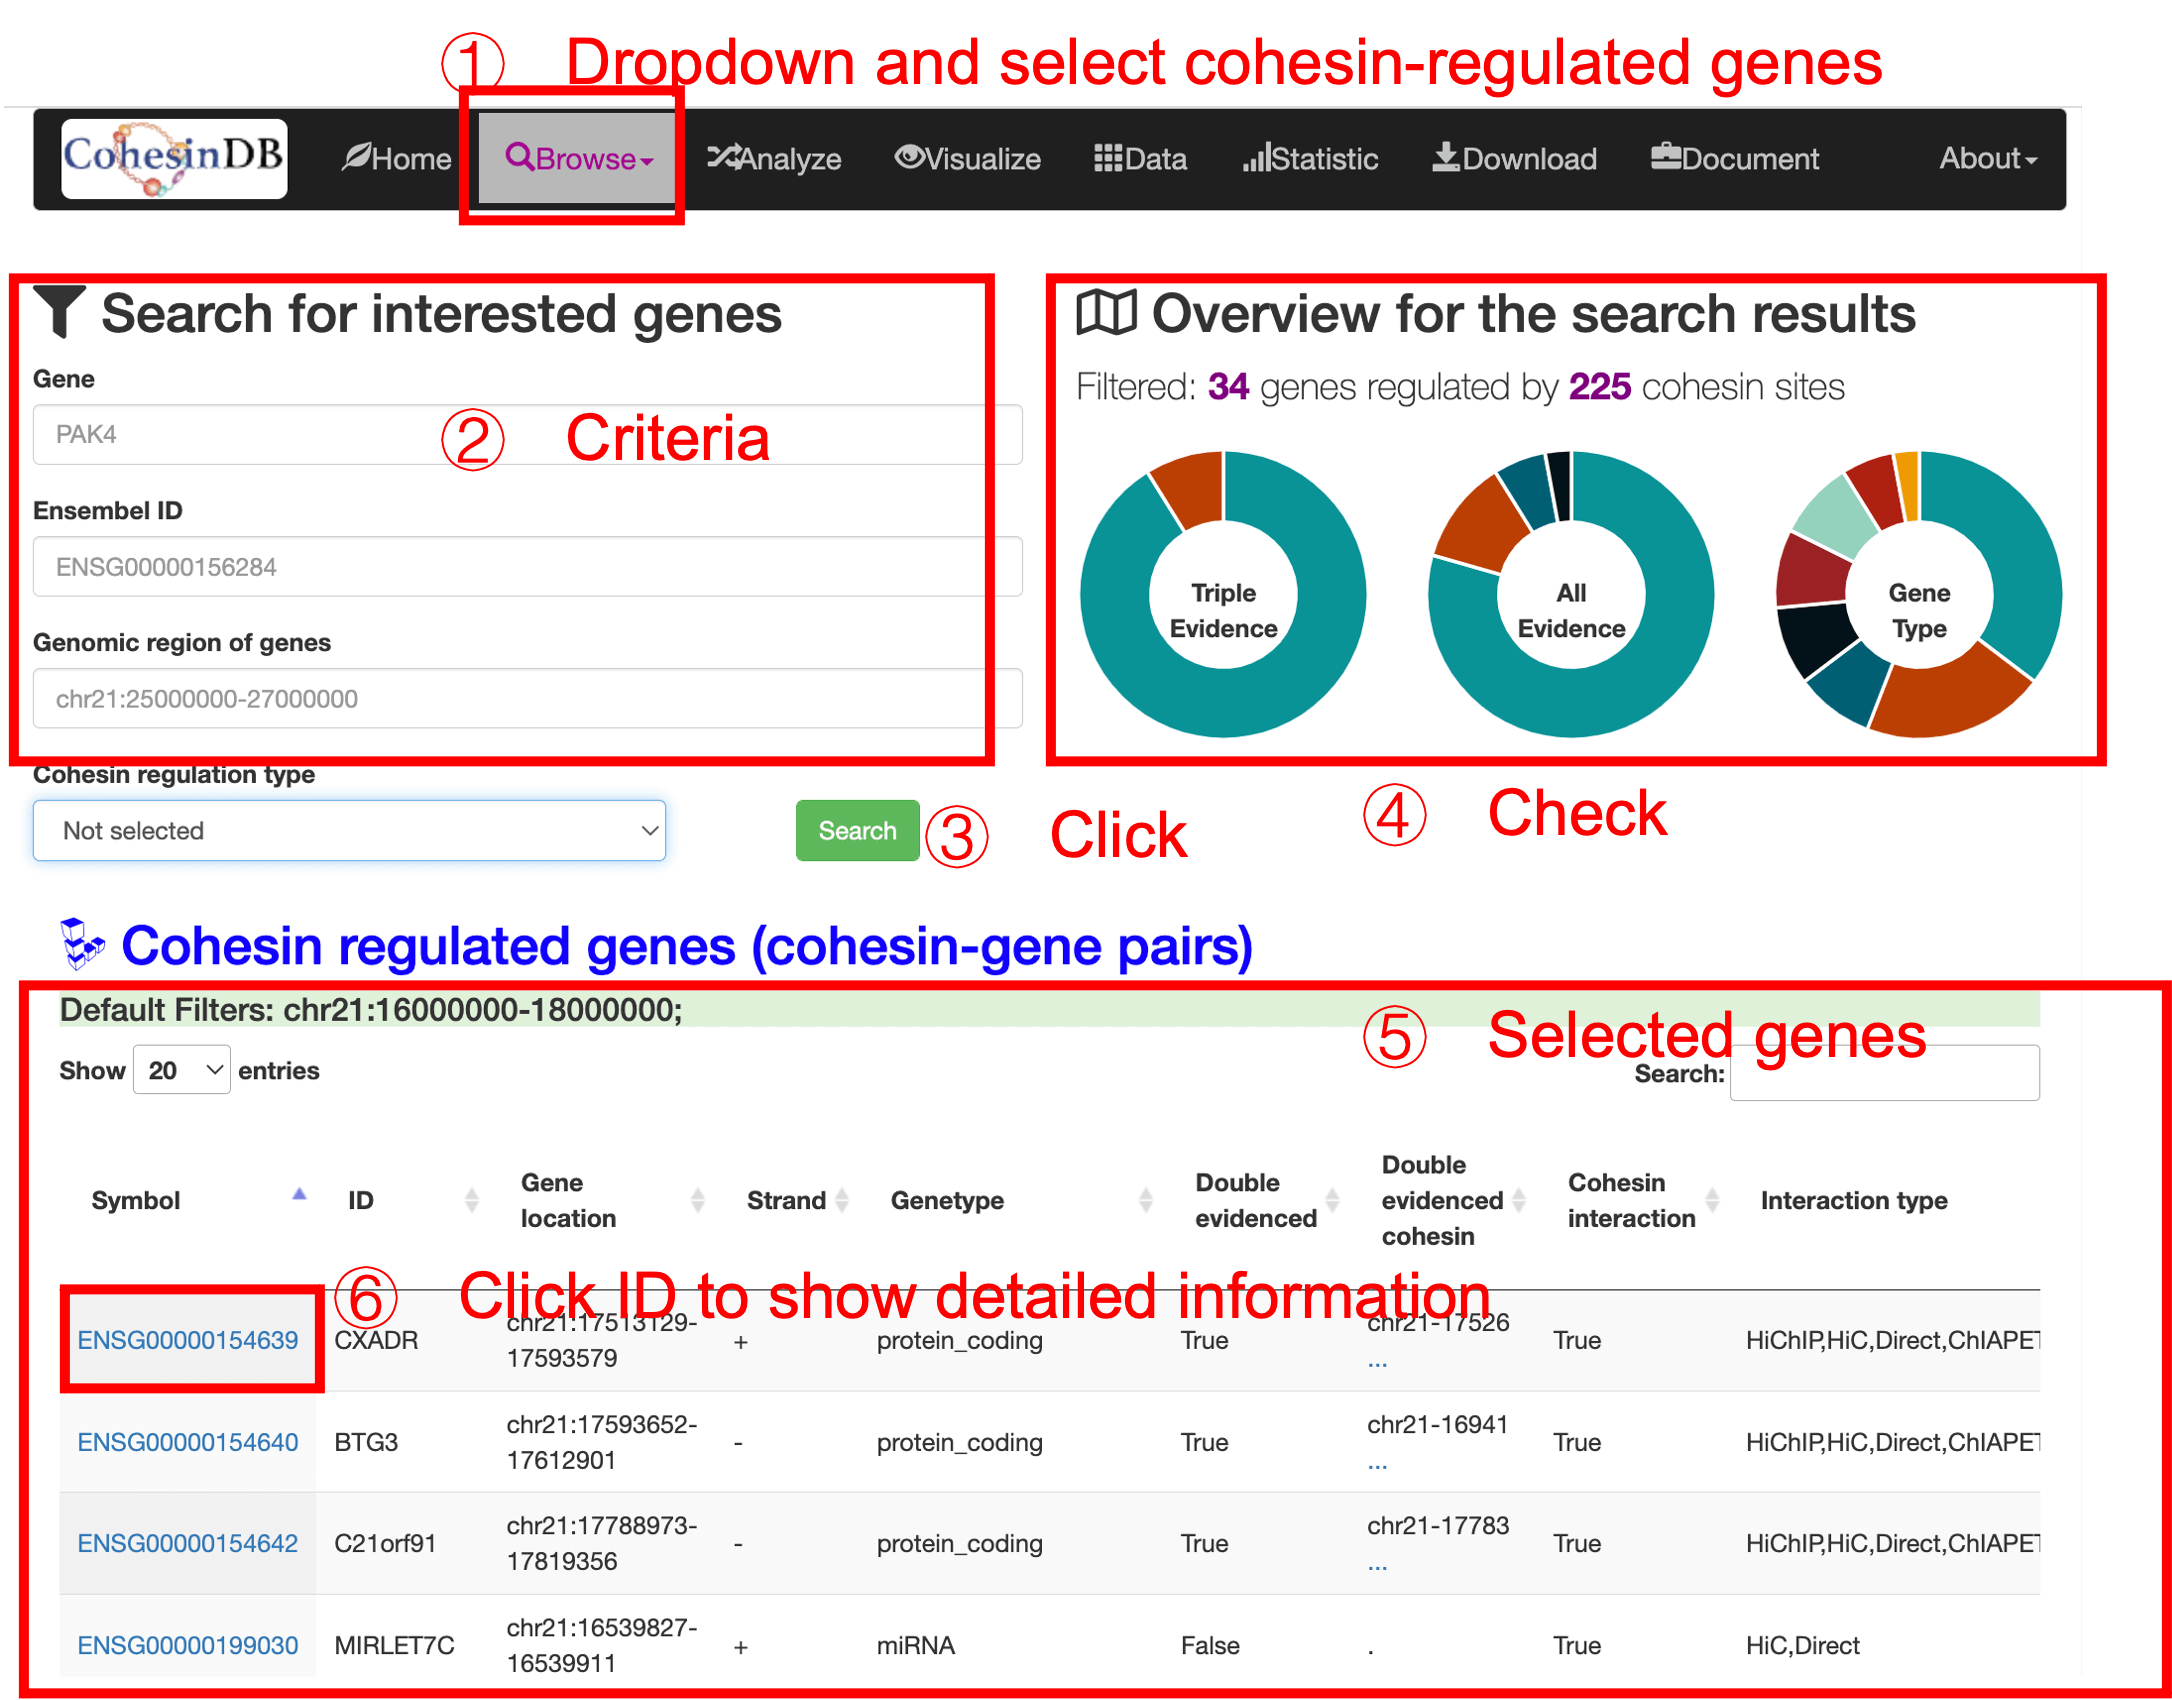
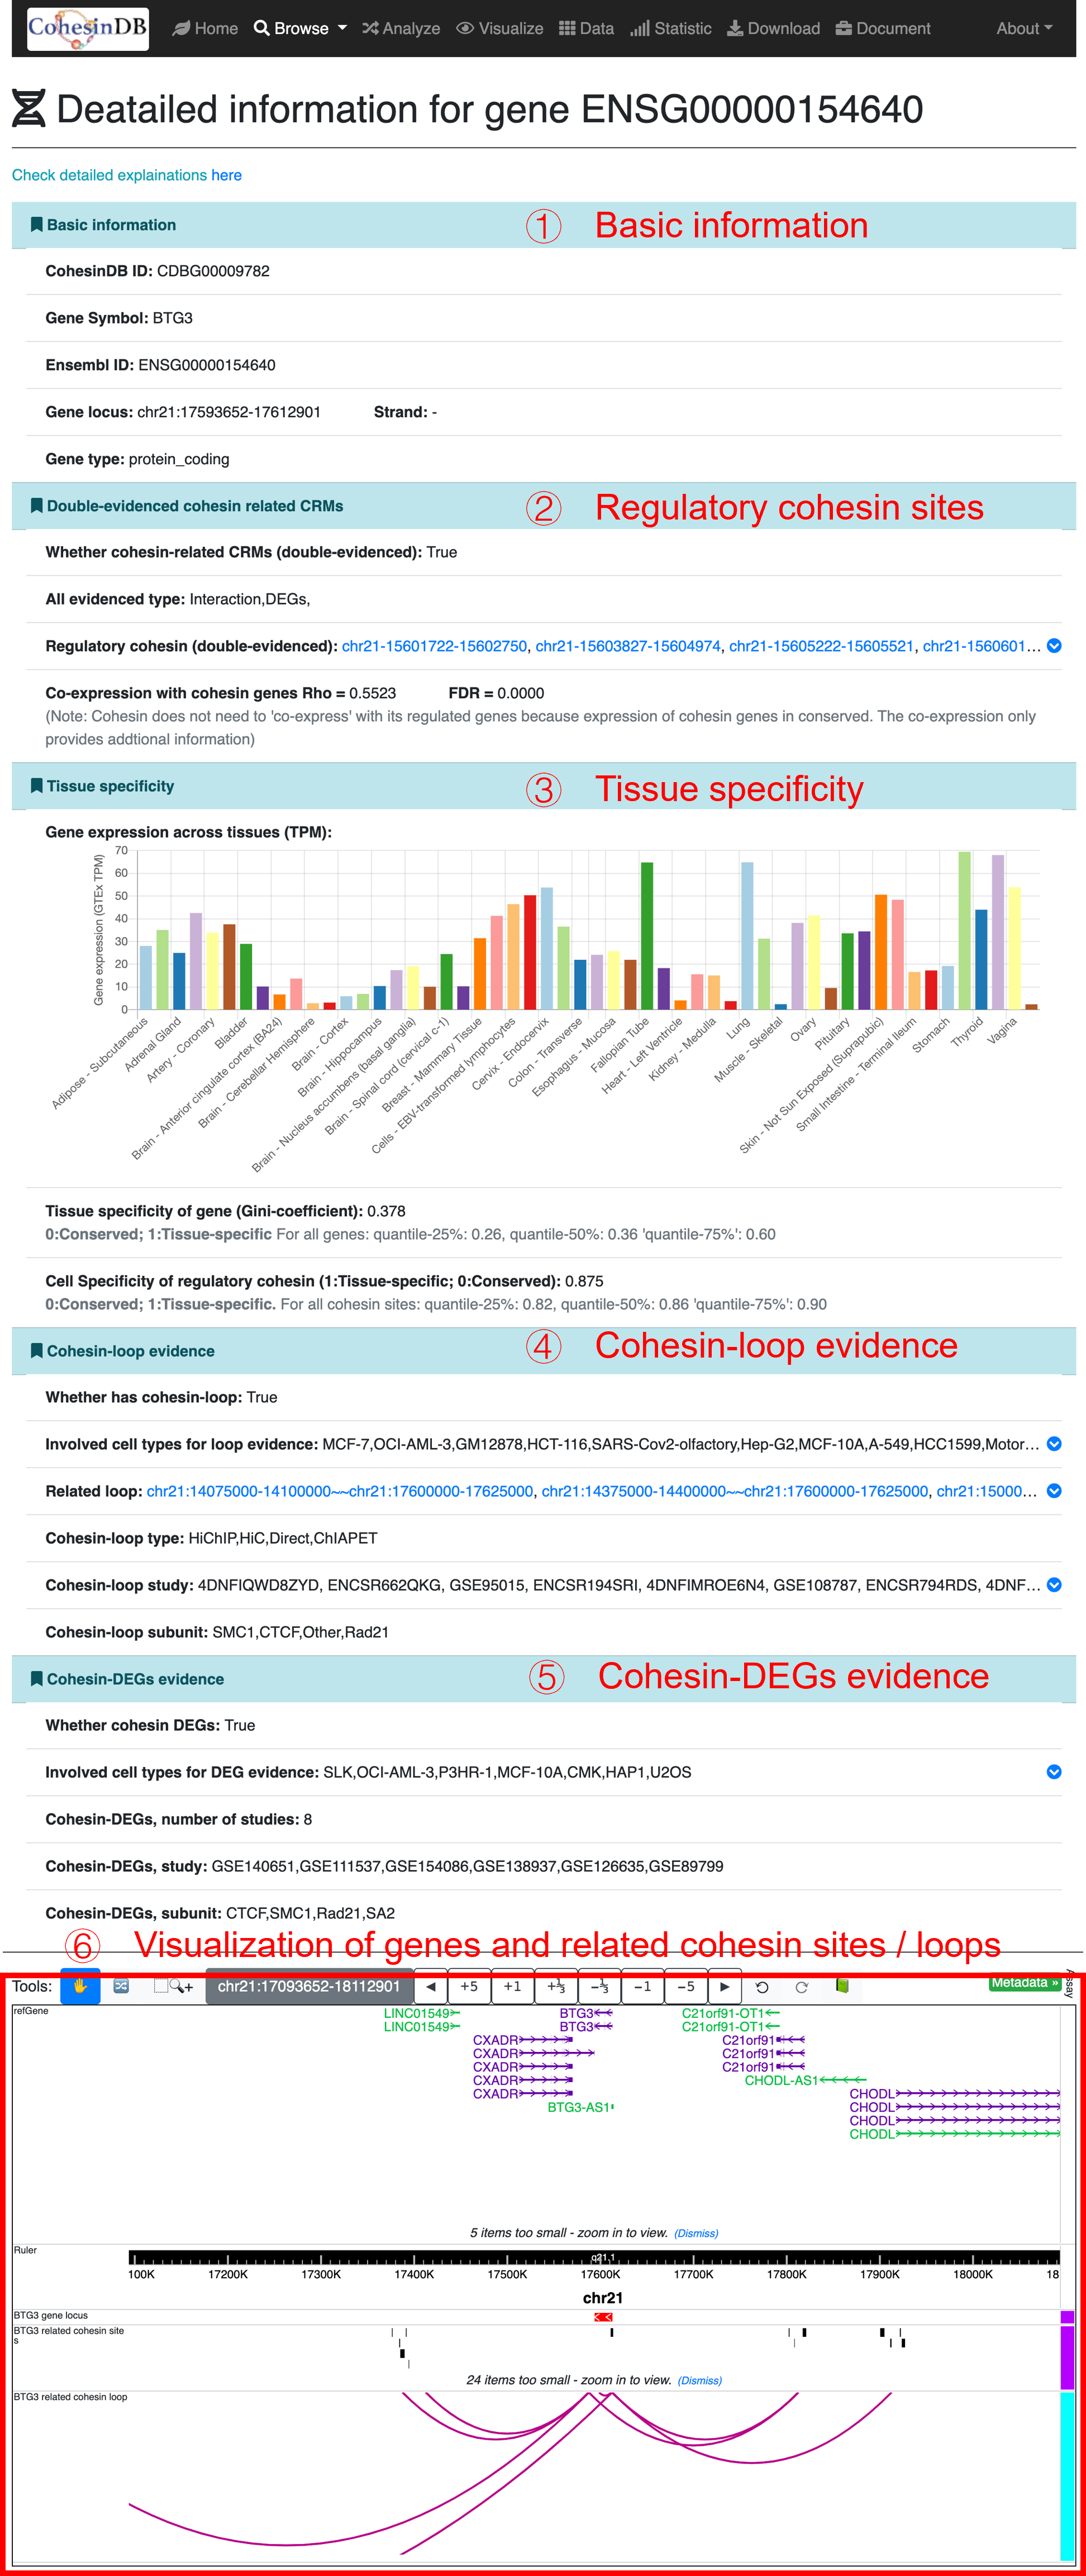
By click on the CDB ID (CDBG*), you can enter the details pages for each gene:
Basic information
Double-evidenced regulatory sites
Tissue specificity
Cohesin loop evidence
Cohesin DEGs evidence
Visualization
CohesinDB ID; Gene symbol; Ensembl ID; Gene locus; Strand; Gene type.
Whether cohesin-regulated gene; Evidence types; regulatory cohesin sites; Co-expression with cohesin genes.
Gene expression levels (TPM) across tissues. The data are from GTEx
Tissue-specificity (Gini coefficient) of genes
Cell-specificity of regulatory cohesin.
Whether connect cohesin via cohesin loops; Involved cell types; Connected loops; Loop type (Direct means cohesin sites are located on gene body); Loop study; Loop subunit
Whether cohesin DEGs; Involved cell types; Studies; Cohesin subunits.
The plot of selected gene and related cohesin sites and loops. This section is based on the embedding of WashU Epigenome Browser
Analyze
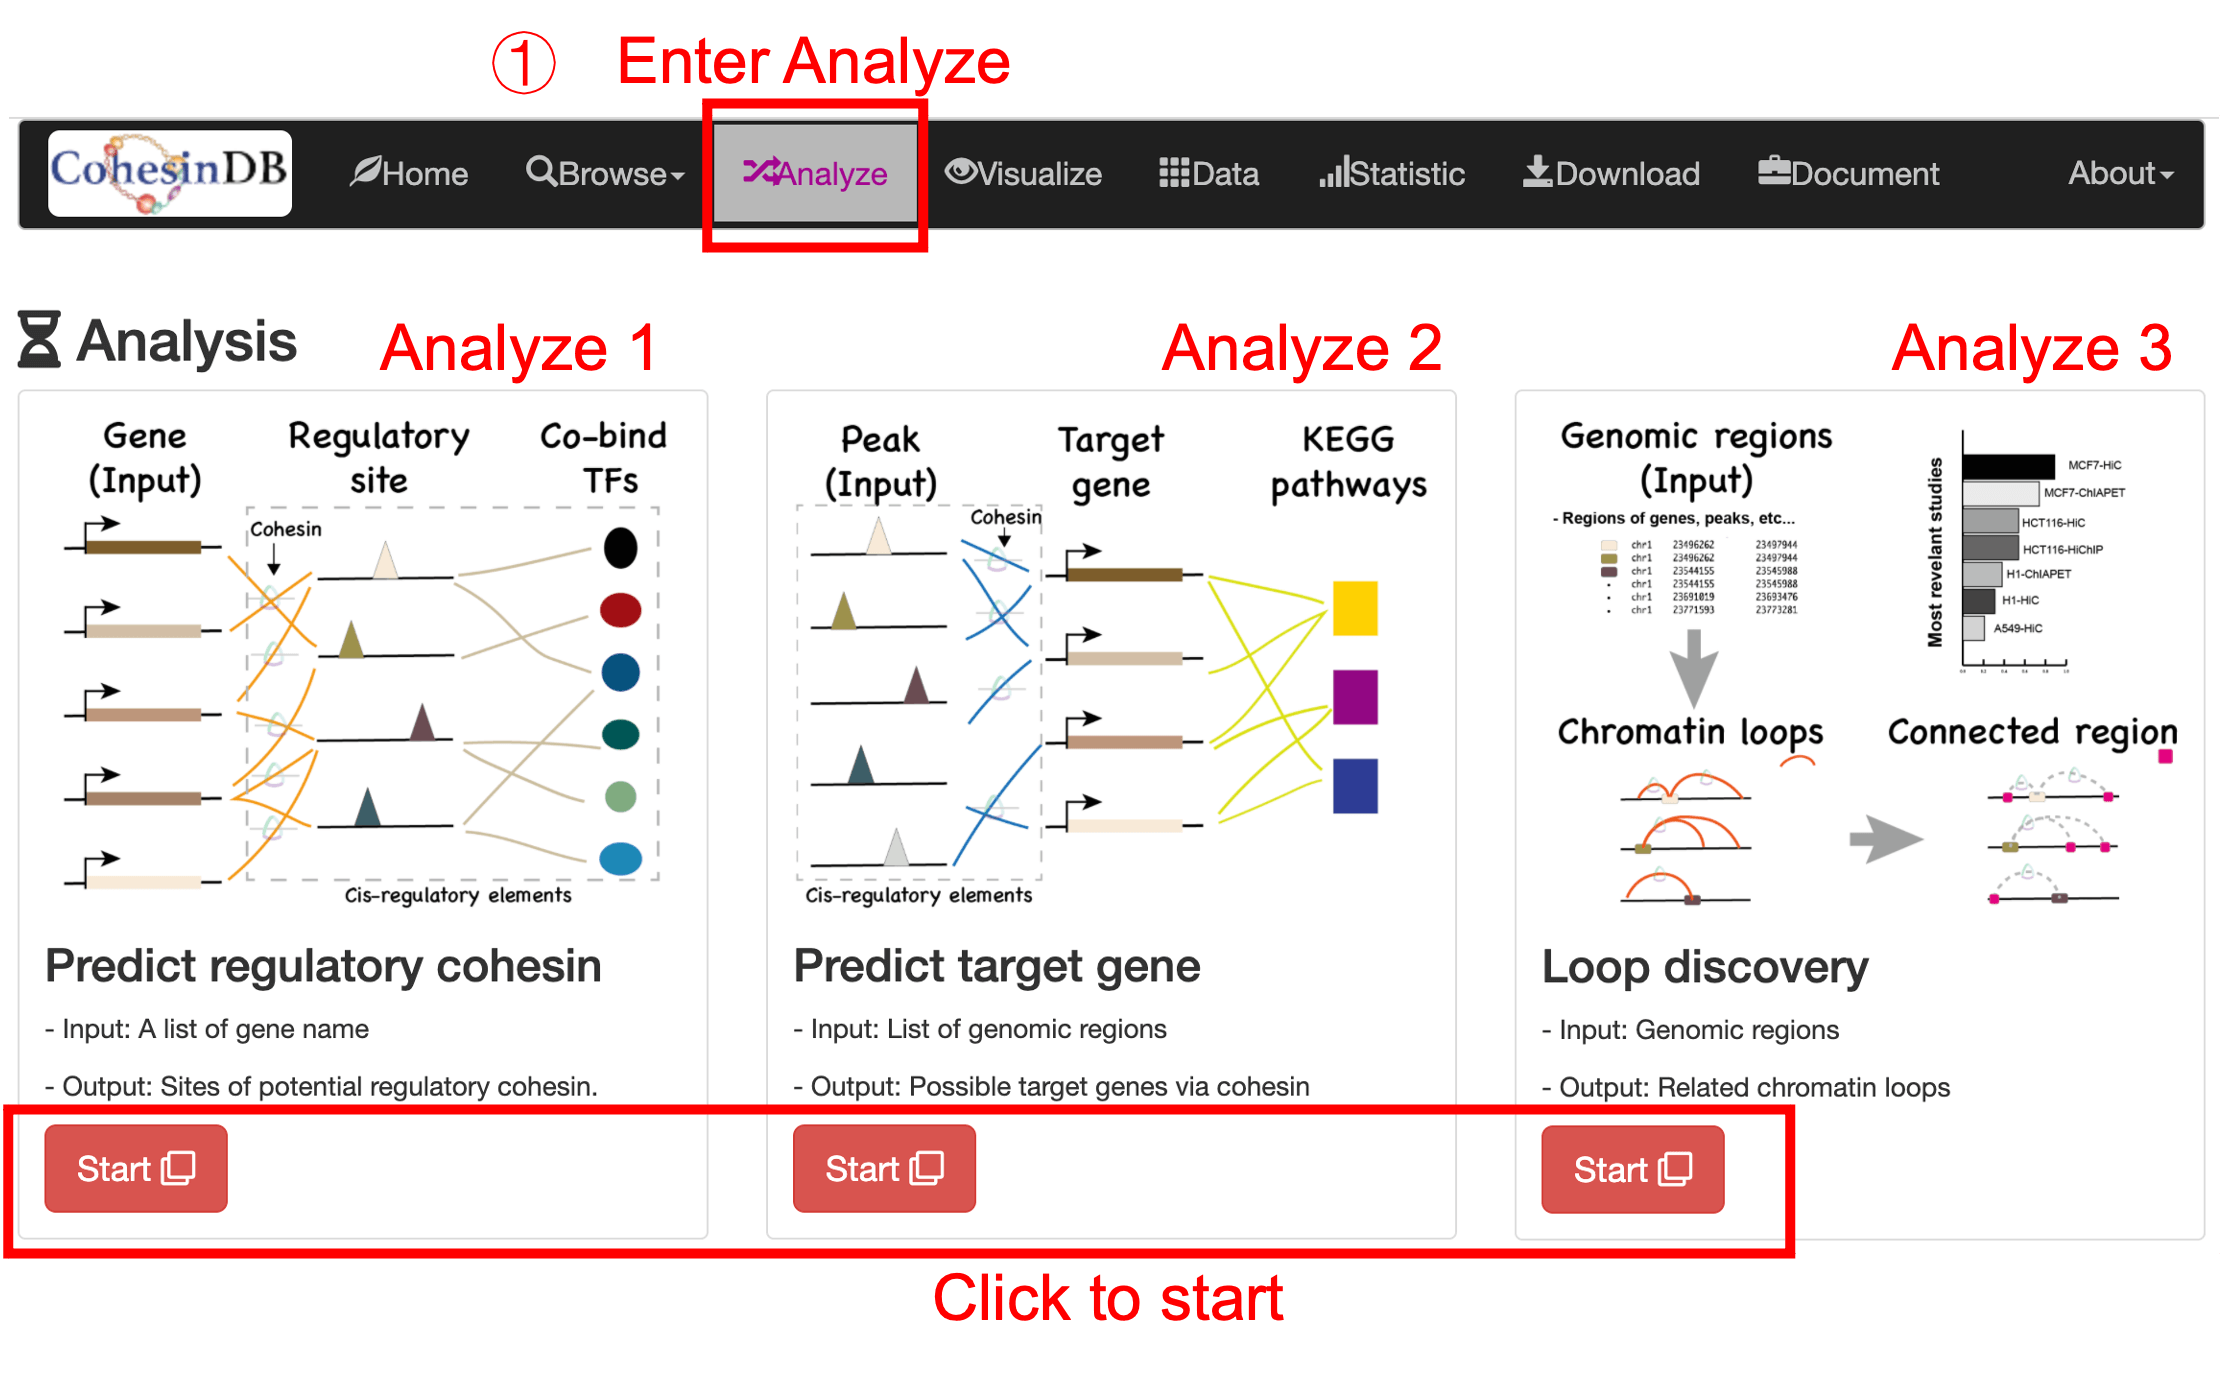
This analyze page is designed for biologist who don't need to know computational knowledge. The analysis includes three part:
- Analyze1: Predict regulatory elements
- Input a list of genes, to obtain the regulatory sites and co-bind transcriptional factors.
- Analyze2: Predict target genes
- Input a list of regions, to obtain the target genes and gene pathway.
- Analyze3: Loop discovery
- Input a list of genomic regions, to obtain the related loops and the connected regions (the other end of the loops).
Analyze gene set
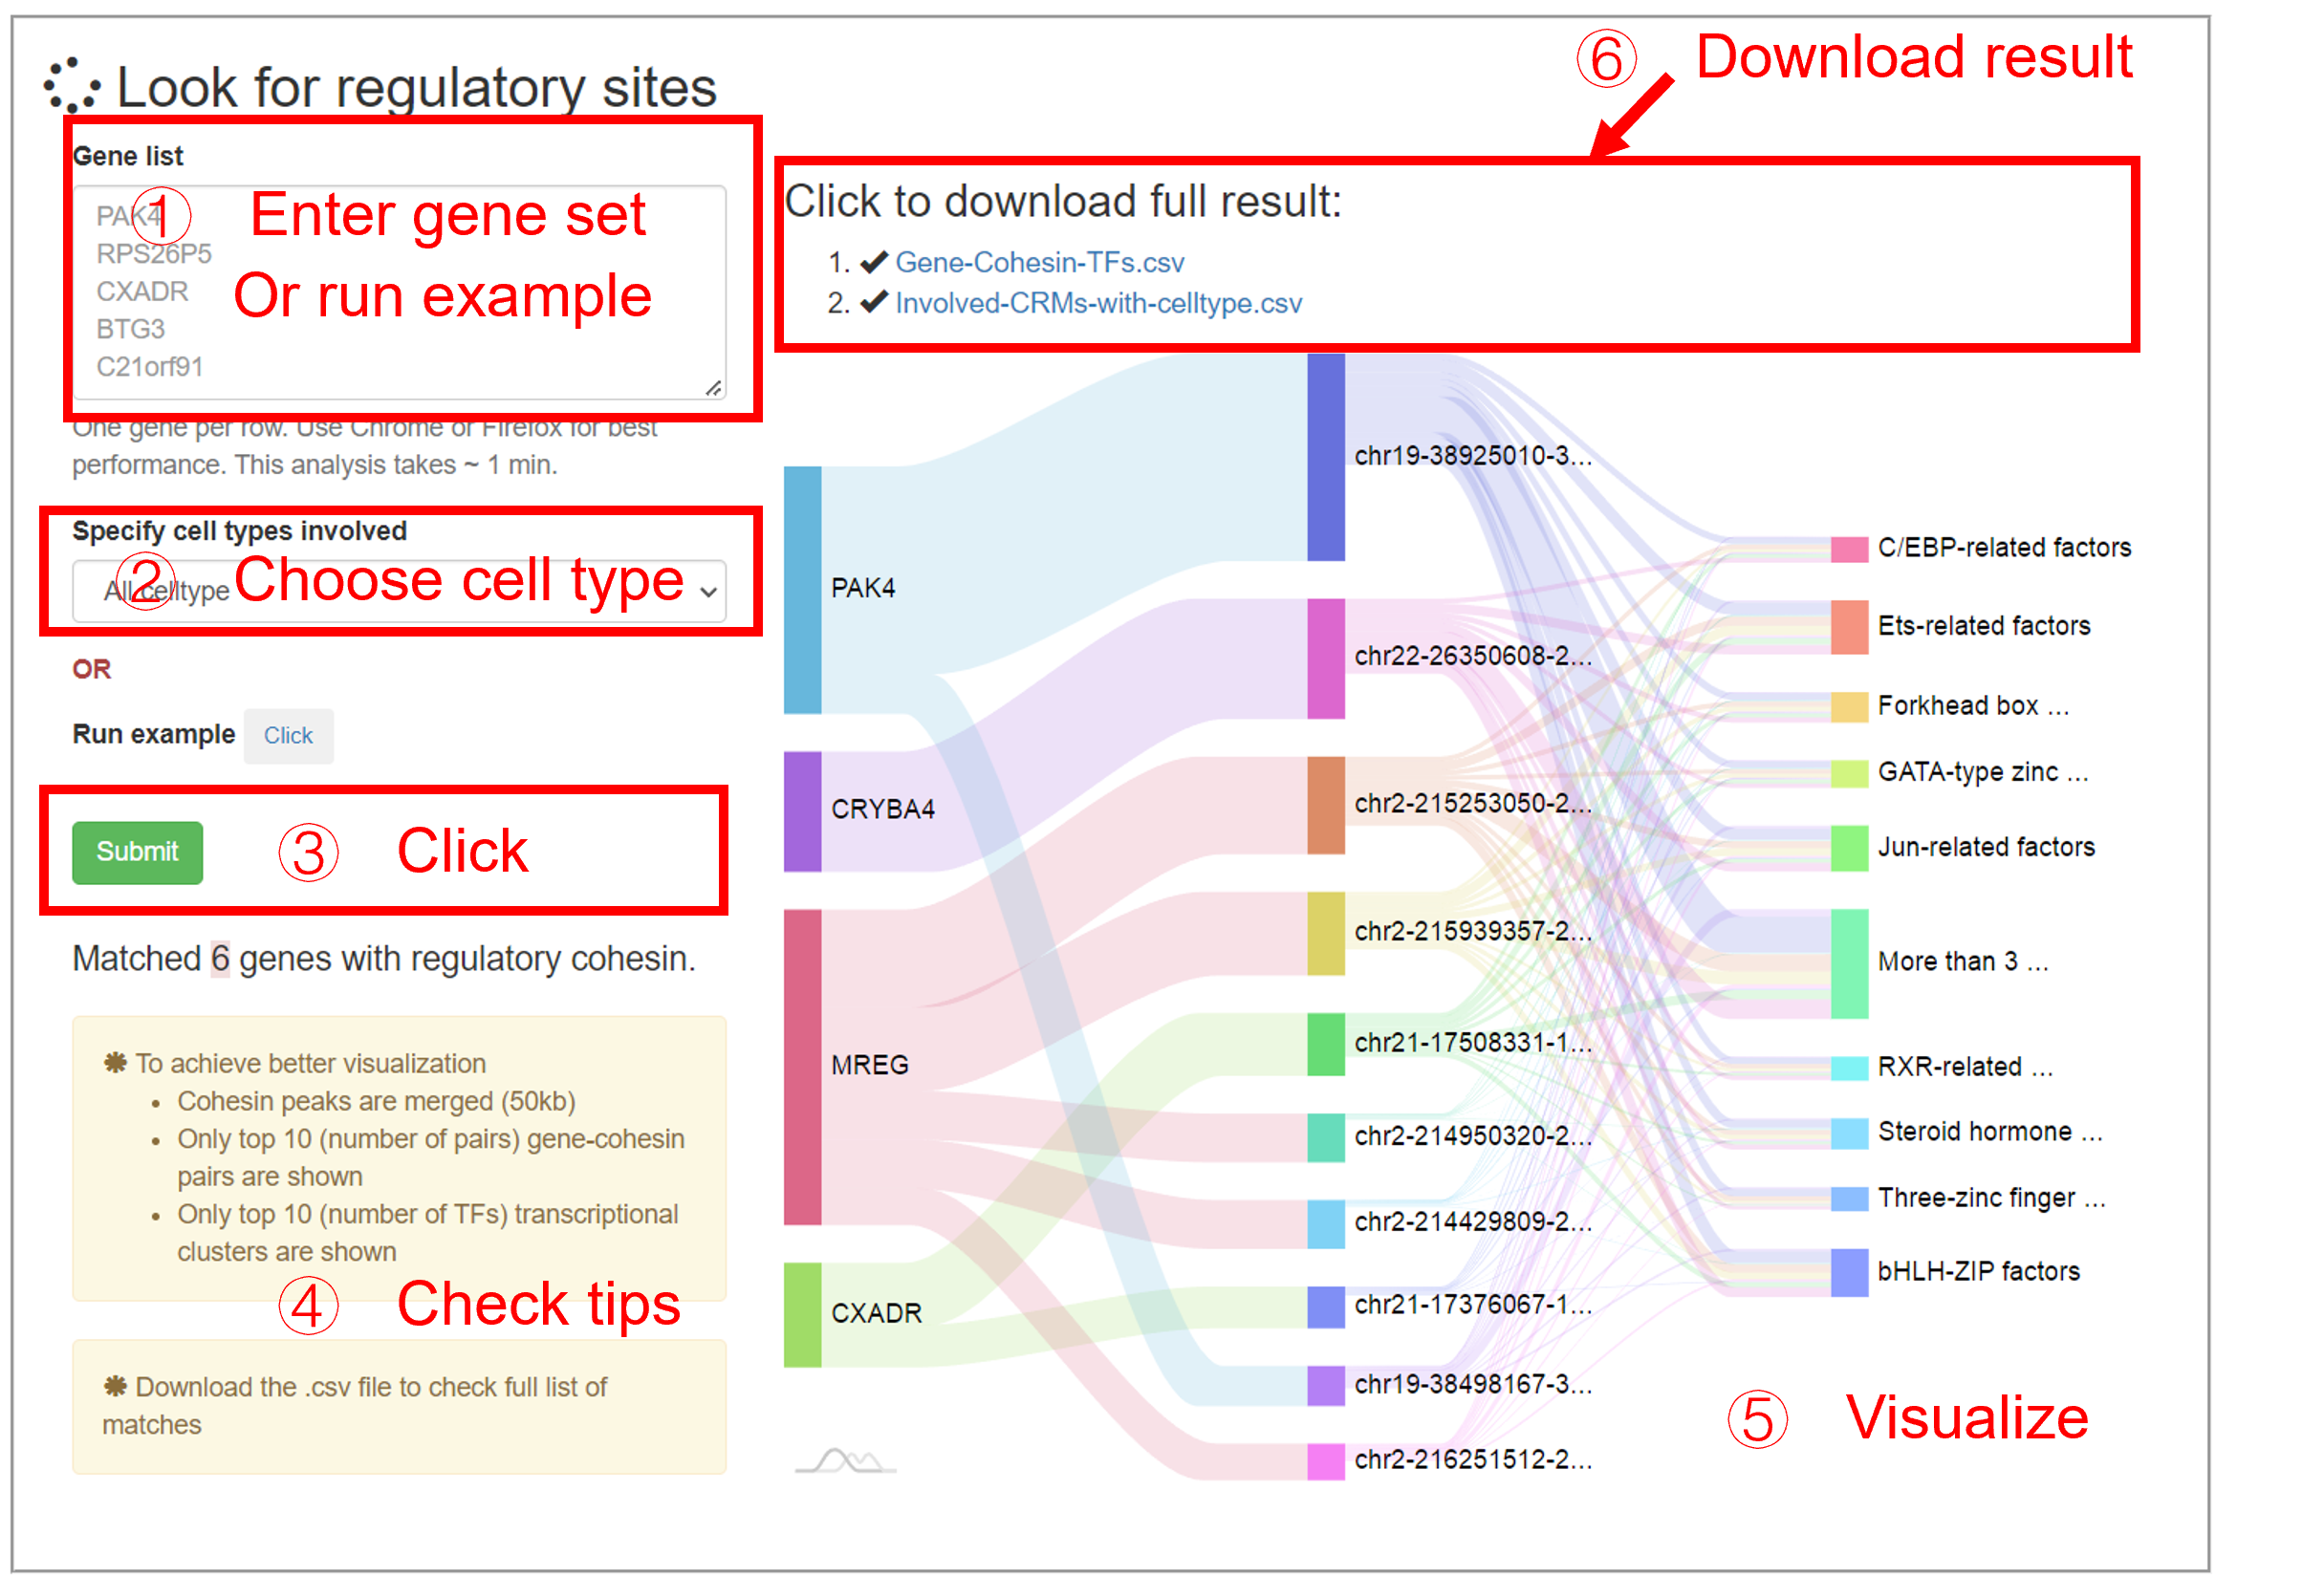
This analysis takes a gene set as input, then output the regulatory sites with co-bound TFs. This analysis can be performed by selecting the specified cell type, or by disregarding the cell type (All celltype). The input should be a list of gene symbol in HGNC format. Because one gene can be regulated by many genomic loci where many TFs located, the plot only shows partial results: (1) cohesin sites are merged; (2) Cohesin sites that involved in many (top 10) cohesin-gene pairs are shown; (3) The most frequently involved (Top 10) TFs are shown. The full results are provided with a .csv file which contains 3 columns:
| Gene | Regulatory-Cohesin | Cobind-TFs |
|---|---|---|
| PAK4 | chr19-38150586-38152046 | ZFX,SP140,ZBTB48,ESR1... |
Analyze a list of genomic regions
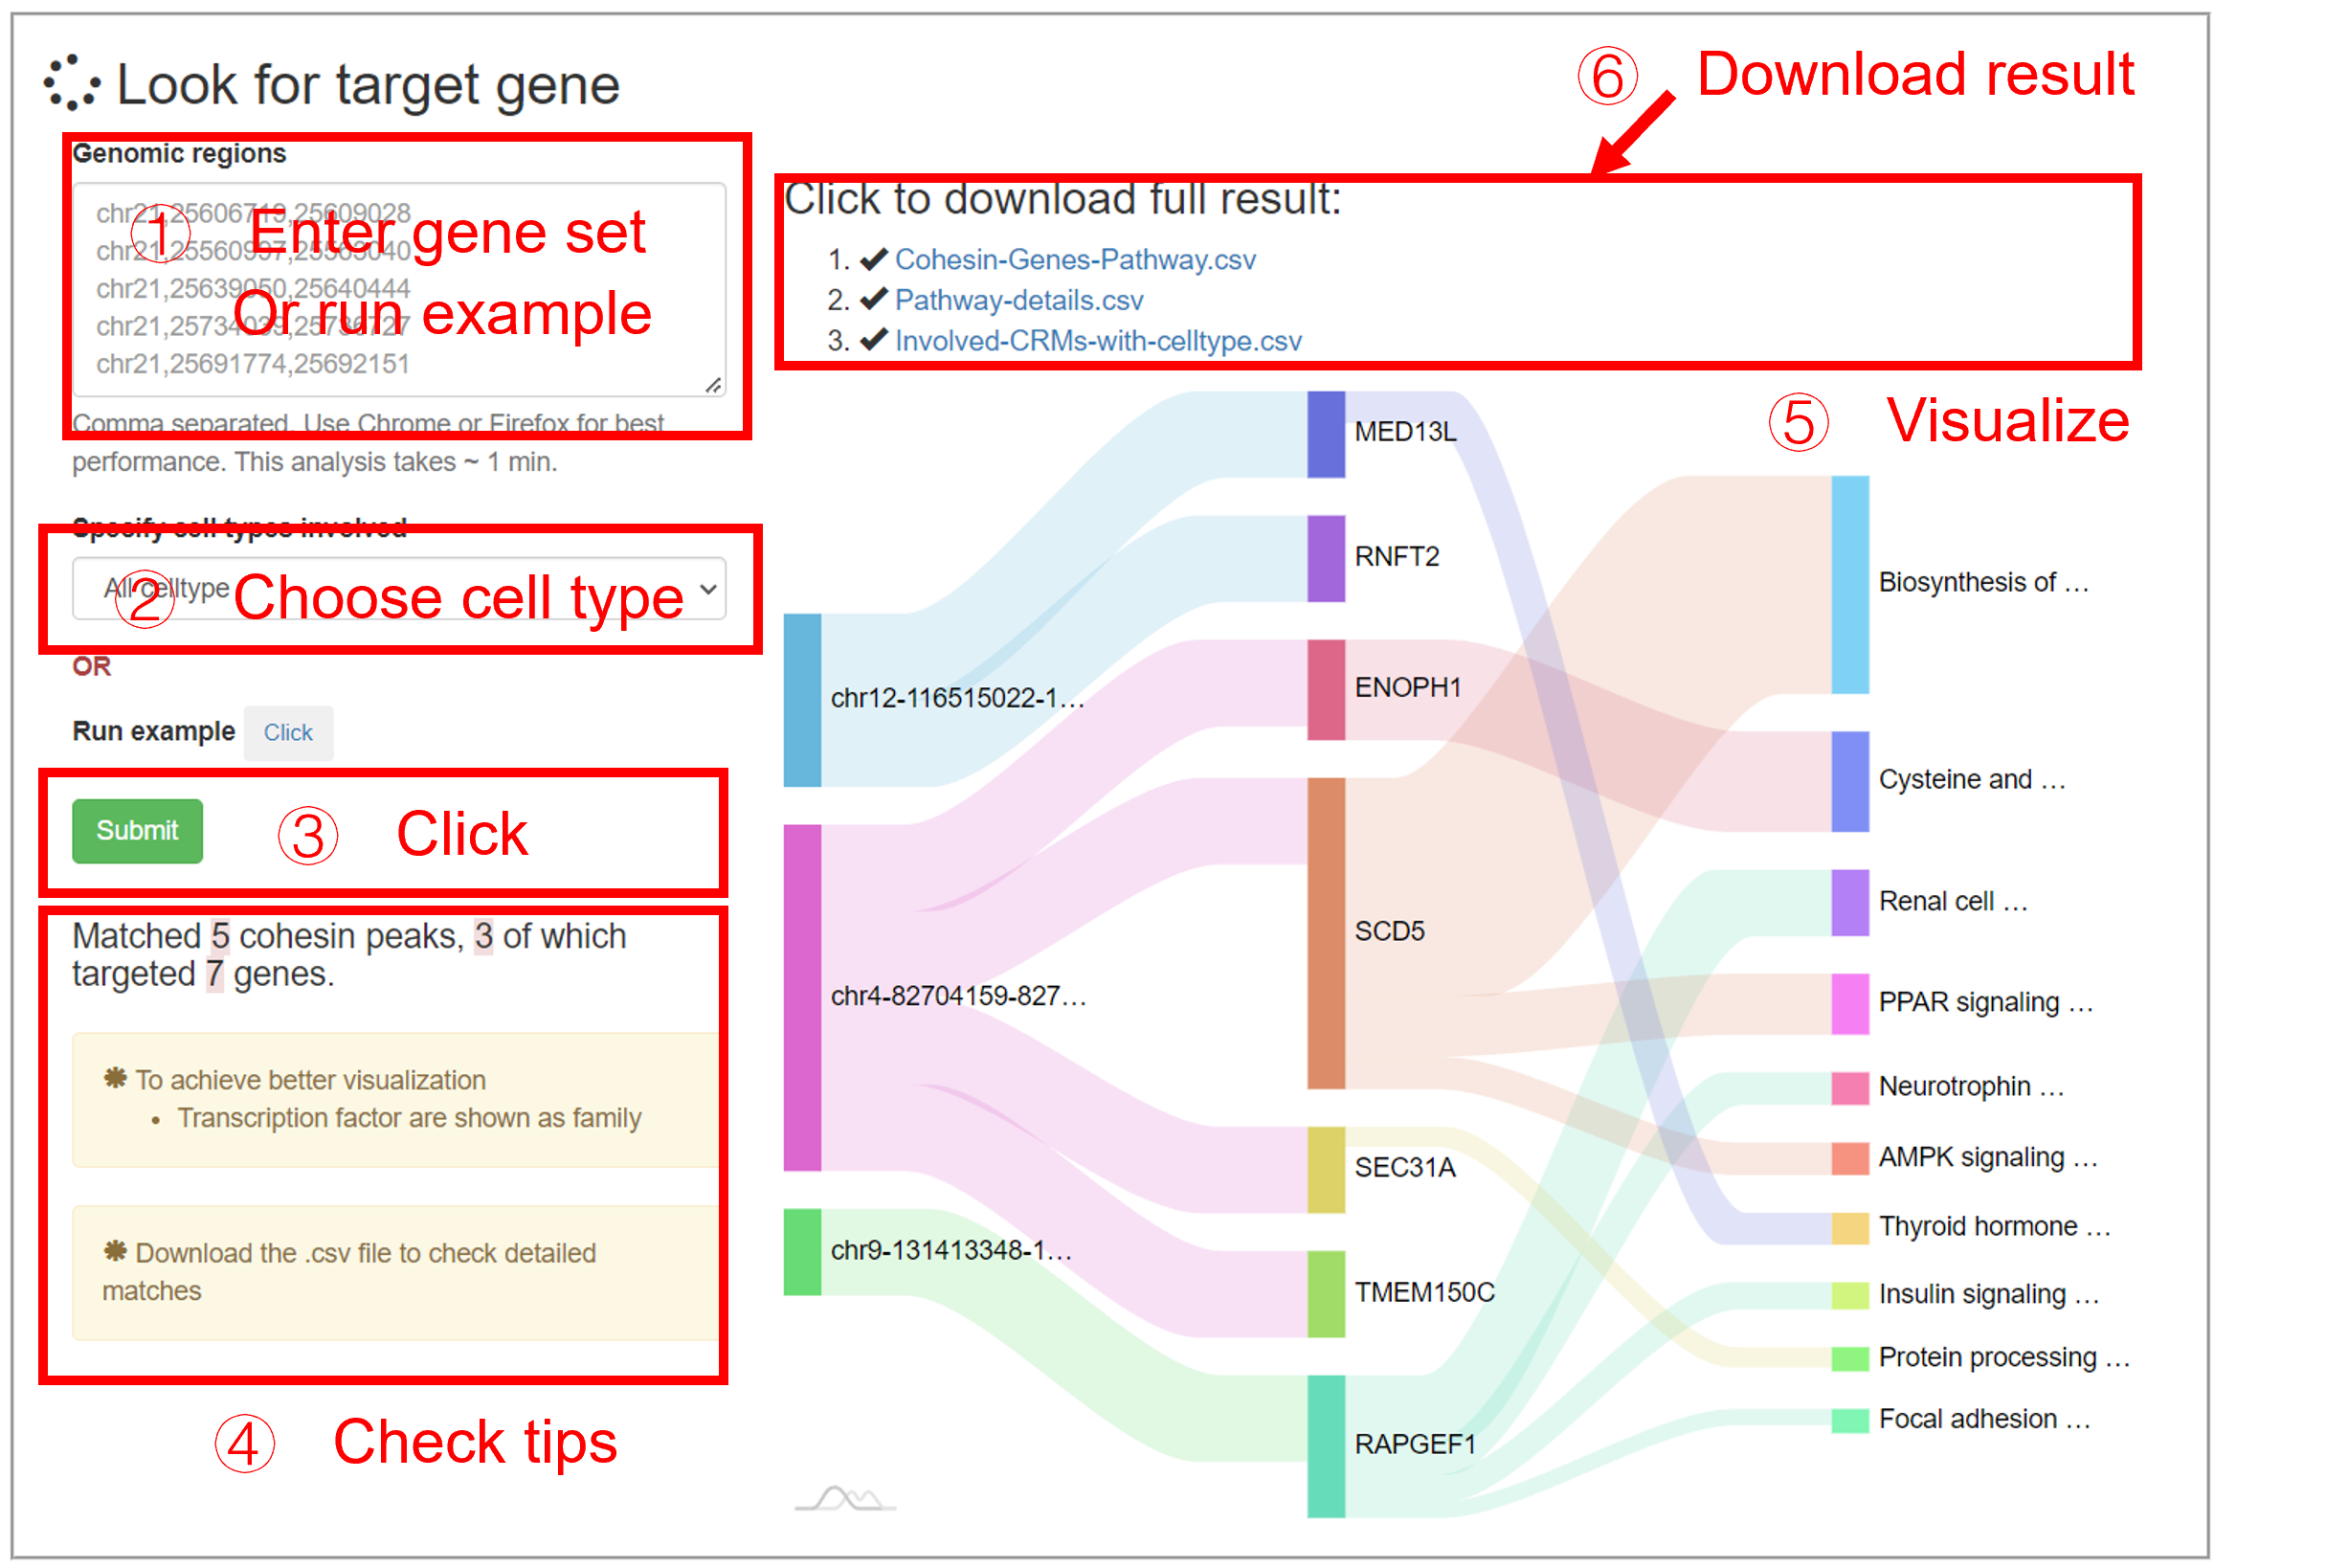
This analysis takes a list of genomic regions as input, then output the candidate genes that are regulated by the input regions. The input should be comma-separated genomic regions under hg38 reference.This analysis can be performed by selecting the specified cell type, or by disregarding the cell type (All celltype). Similarly, the plot only shows partial results: (1) Genes that are involved in many (top 10) cohesin-gene pairs are shown; (2) Gene pathway with the most (top 10) significant p-value are shown. The full results are provided by two downloadable files:
| Input sites | Target genes | Significant_enriched_pathway |
|---|---|---|
| chr12-116515022-116516937 | MED13L | Thyroid hormone signaling pathway |
| Gene_set | Term | Overlap | P-value | ... |
|---|---|---|---|---|
| KEGG_2021_Human | Biosynthesis of unsaturated fatty acids | 1/27 | 0.0094131205361766 | ... |
Analyze loop
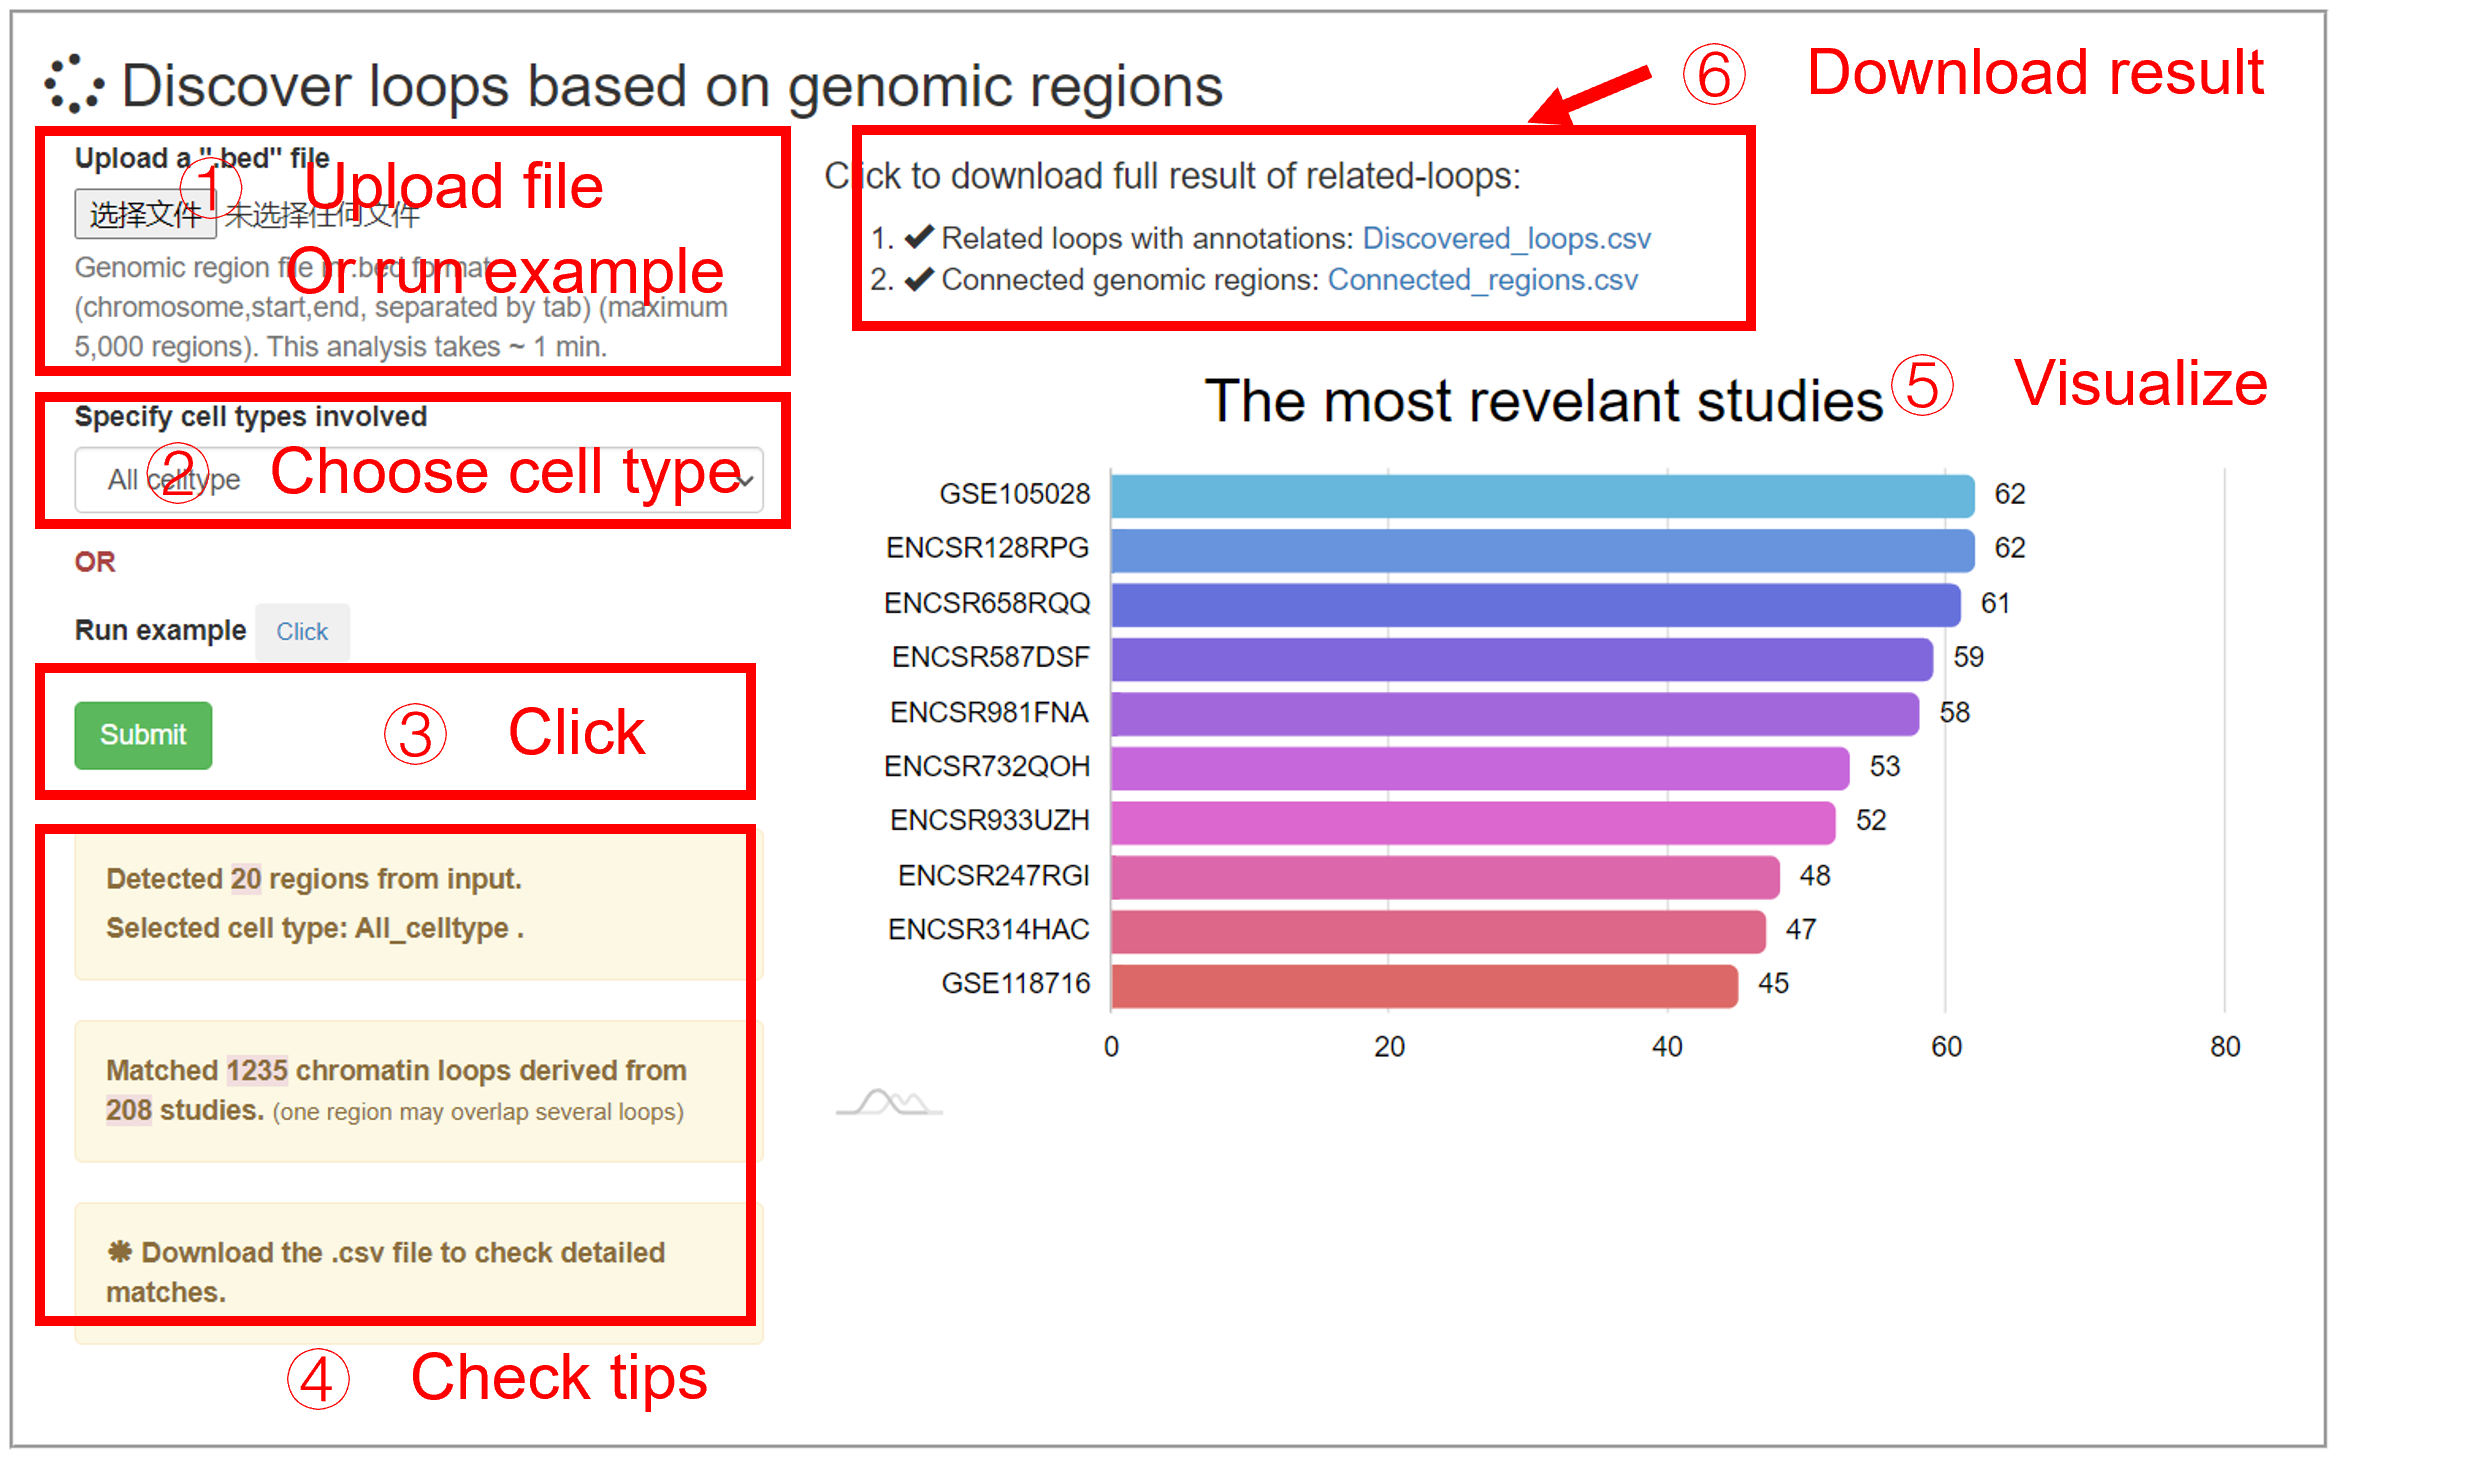
This analyze is to find chromatin loop for a list of genomic loci. The output are revelant chromatin loops and the connected regions by the loops. Rather than treating chromatin as a linear model (i.e., nearby regions (±5kb) of interest loci), this analysis enables researchers to study genomic loci of interest in a higher-dimensional way. For example, the connected regions may far (>2 mb) away from the input regions, which are not considered in the linear model.
The input file should be comma-separated .bed format. Only the first 3 columns are used. This analysis can be performed by selecting the specified cell type, or by disregarding the cell type (All celltype). The plot on the right panel shows the most (to 10) relevant study (ChIA-PET, Hi-ChIP or Hi-C). The downloadable files include discovered loops (columns 1-6: two anchors of loops, column 7: studies.) and the connected regions (columns 1-3: input regions; columns 4-6: connected regions).
Visualize
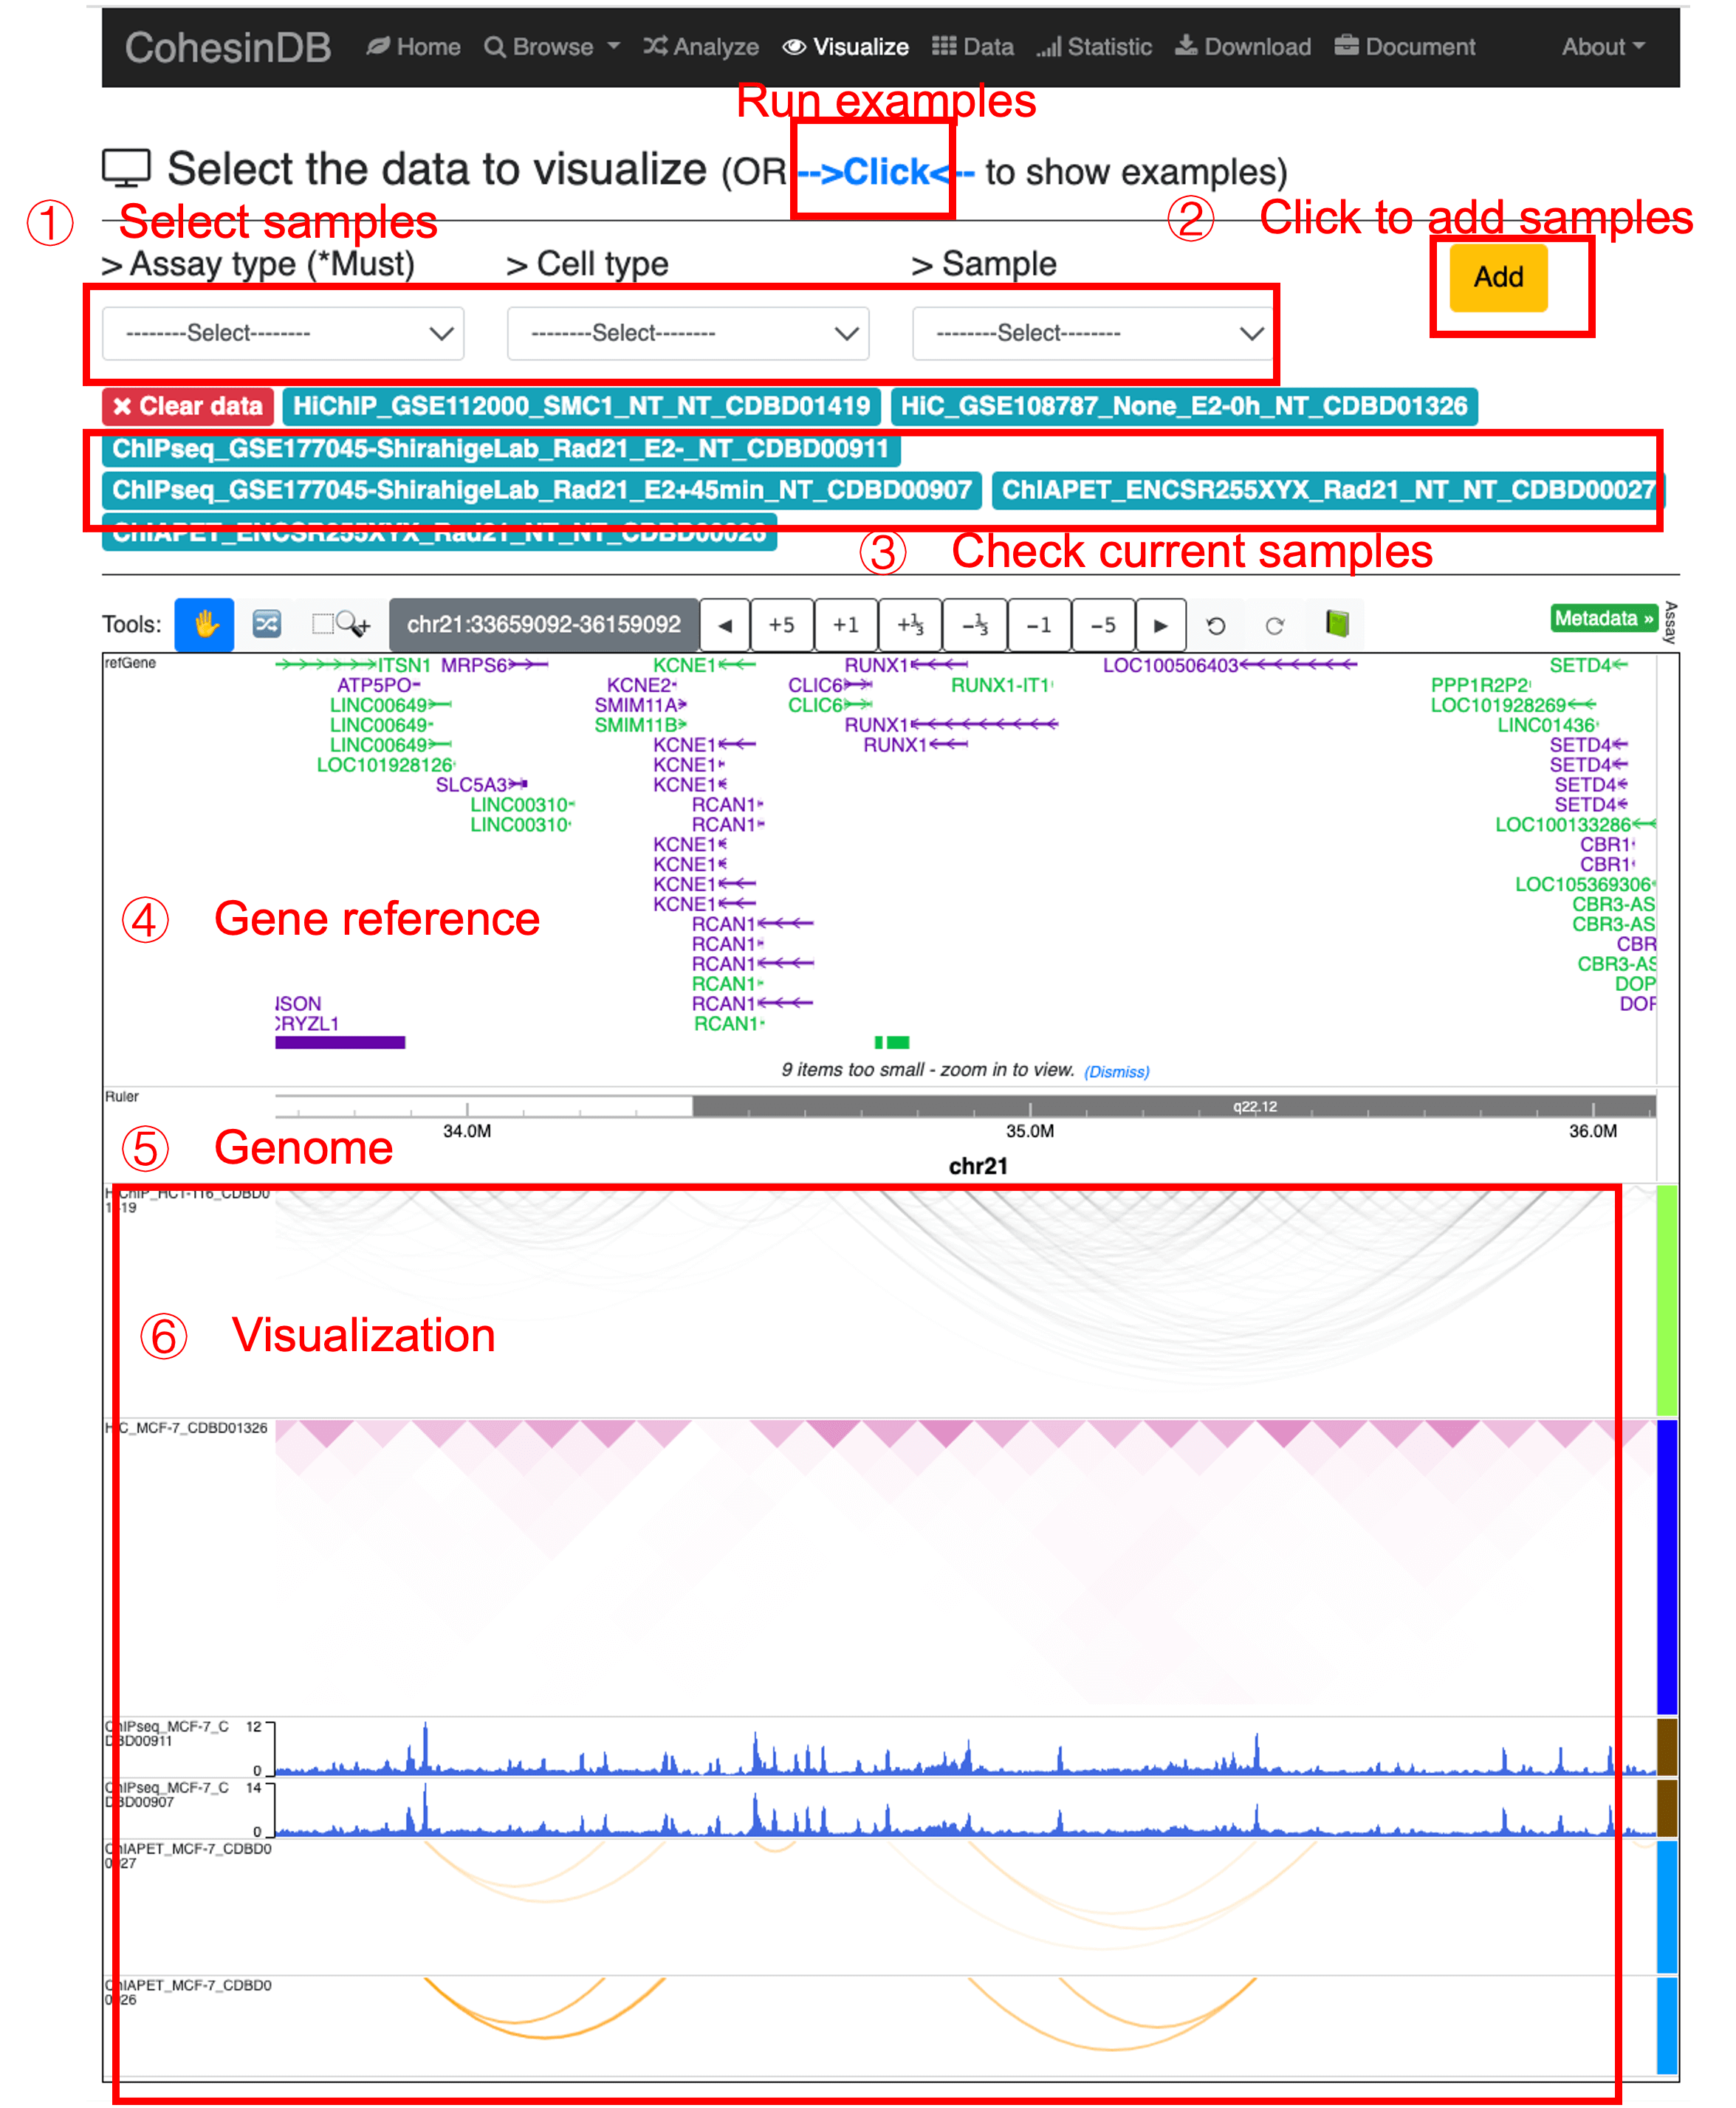
This page provides the visualization for ChIP-seq, ChIA-PET, Hi-ChIP and Hi-C included in CohesinDB.
Basically, this page is based on the API (embedding) provided by WashU Epigenome Browser. The interface is the same with WashU browser.
Try this page by clicking the example.
To use this page. (1) Select the sample of interest. Assay -> Cell -> Sample. (2) Click 'Add' button. The chosen sample will be added to the current sample list. (3) Check current samples or clear all selected data. (4)(5) Check the gene annotation and genome coordinates. You can move the genes/coordinates by 'Clicking and Dragging'. Or you can use the tool bar on the top. (6) Check the visualization of selected samples. You can re-arrange the panels by dragging them.
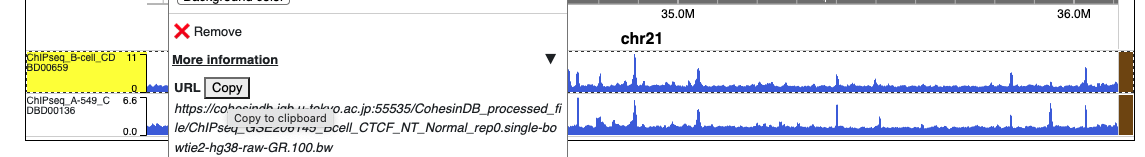
Of note, this "Visualize" page is designed to visualize the NGS dataset used in CohesinDB. CohesinDB does not act as a server for the visualization of external data. Instead, users can find the URLs for each dataset in CohesinDB, by right-clicking on each track (see picture below). Then, this URL for CohesinDB data, together with the user's own data, can be used in other specialized web servers such as WashU Epigenome Browser or UCSC genome browser.
Processed data
This page is for browsing or downloading the processed file for all NGS samples included in CohesinDB.
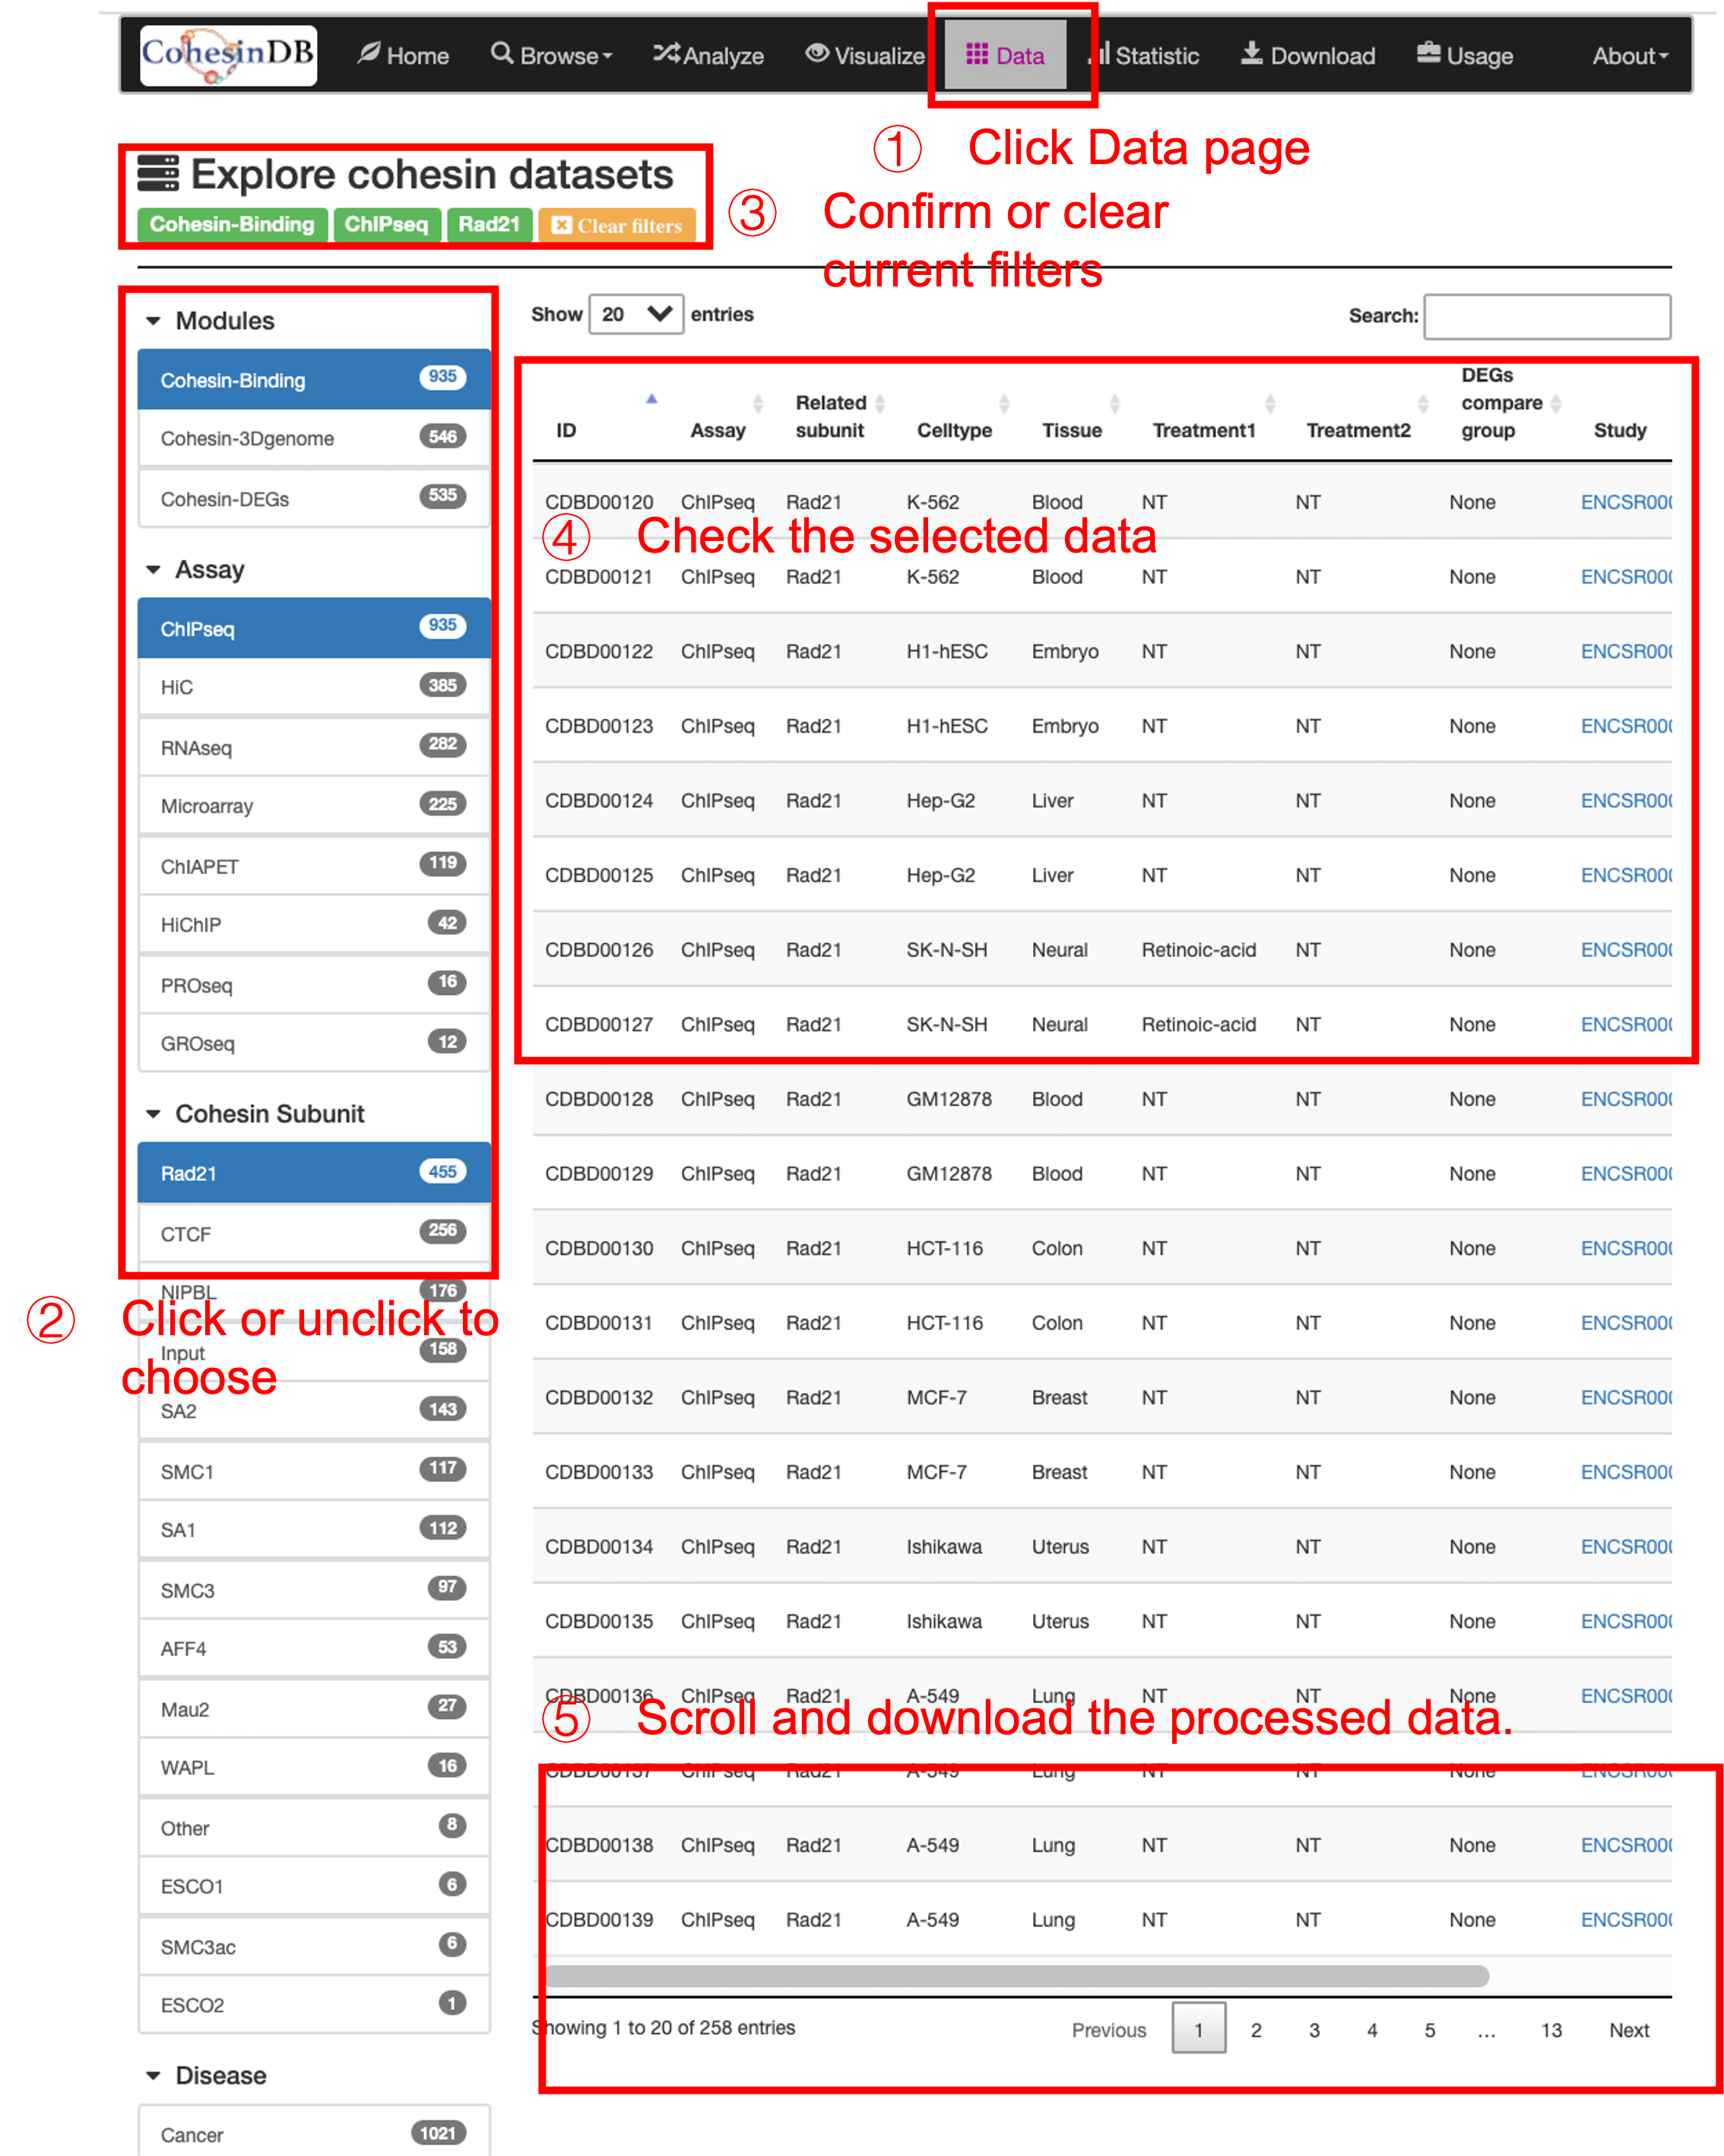
- Either select/unselect the sidebar, or search in the table.
- Confirm or clear current filters. Check the selected data.
- Scroll the table to see the details, or click the ID the see the detail information.
- You can download the table results as a
csvorExcelformat.
By click on the result in the table, you can access the detailed pages for each data or each cell type.
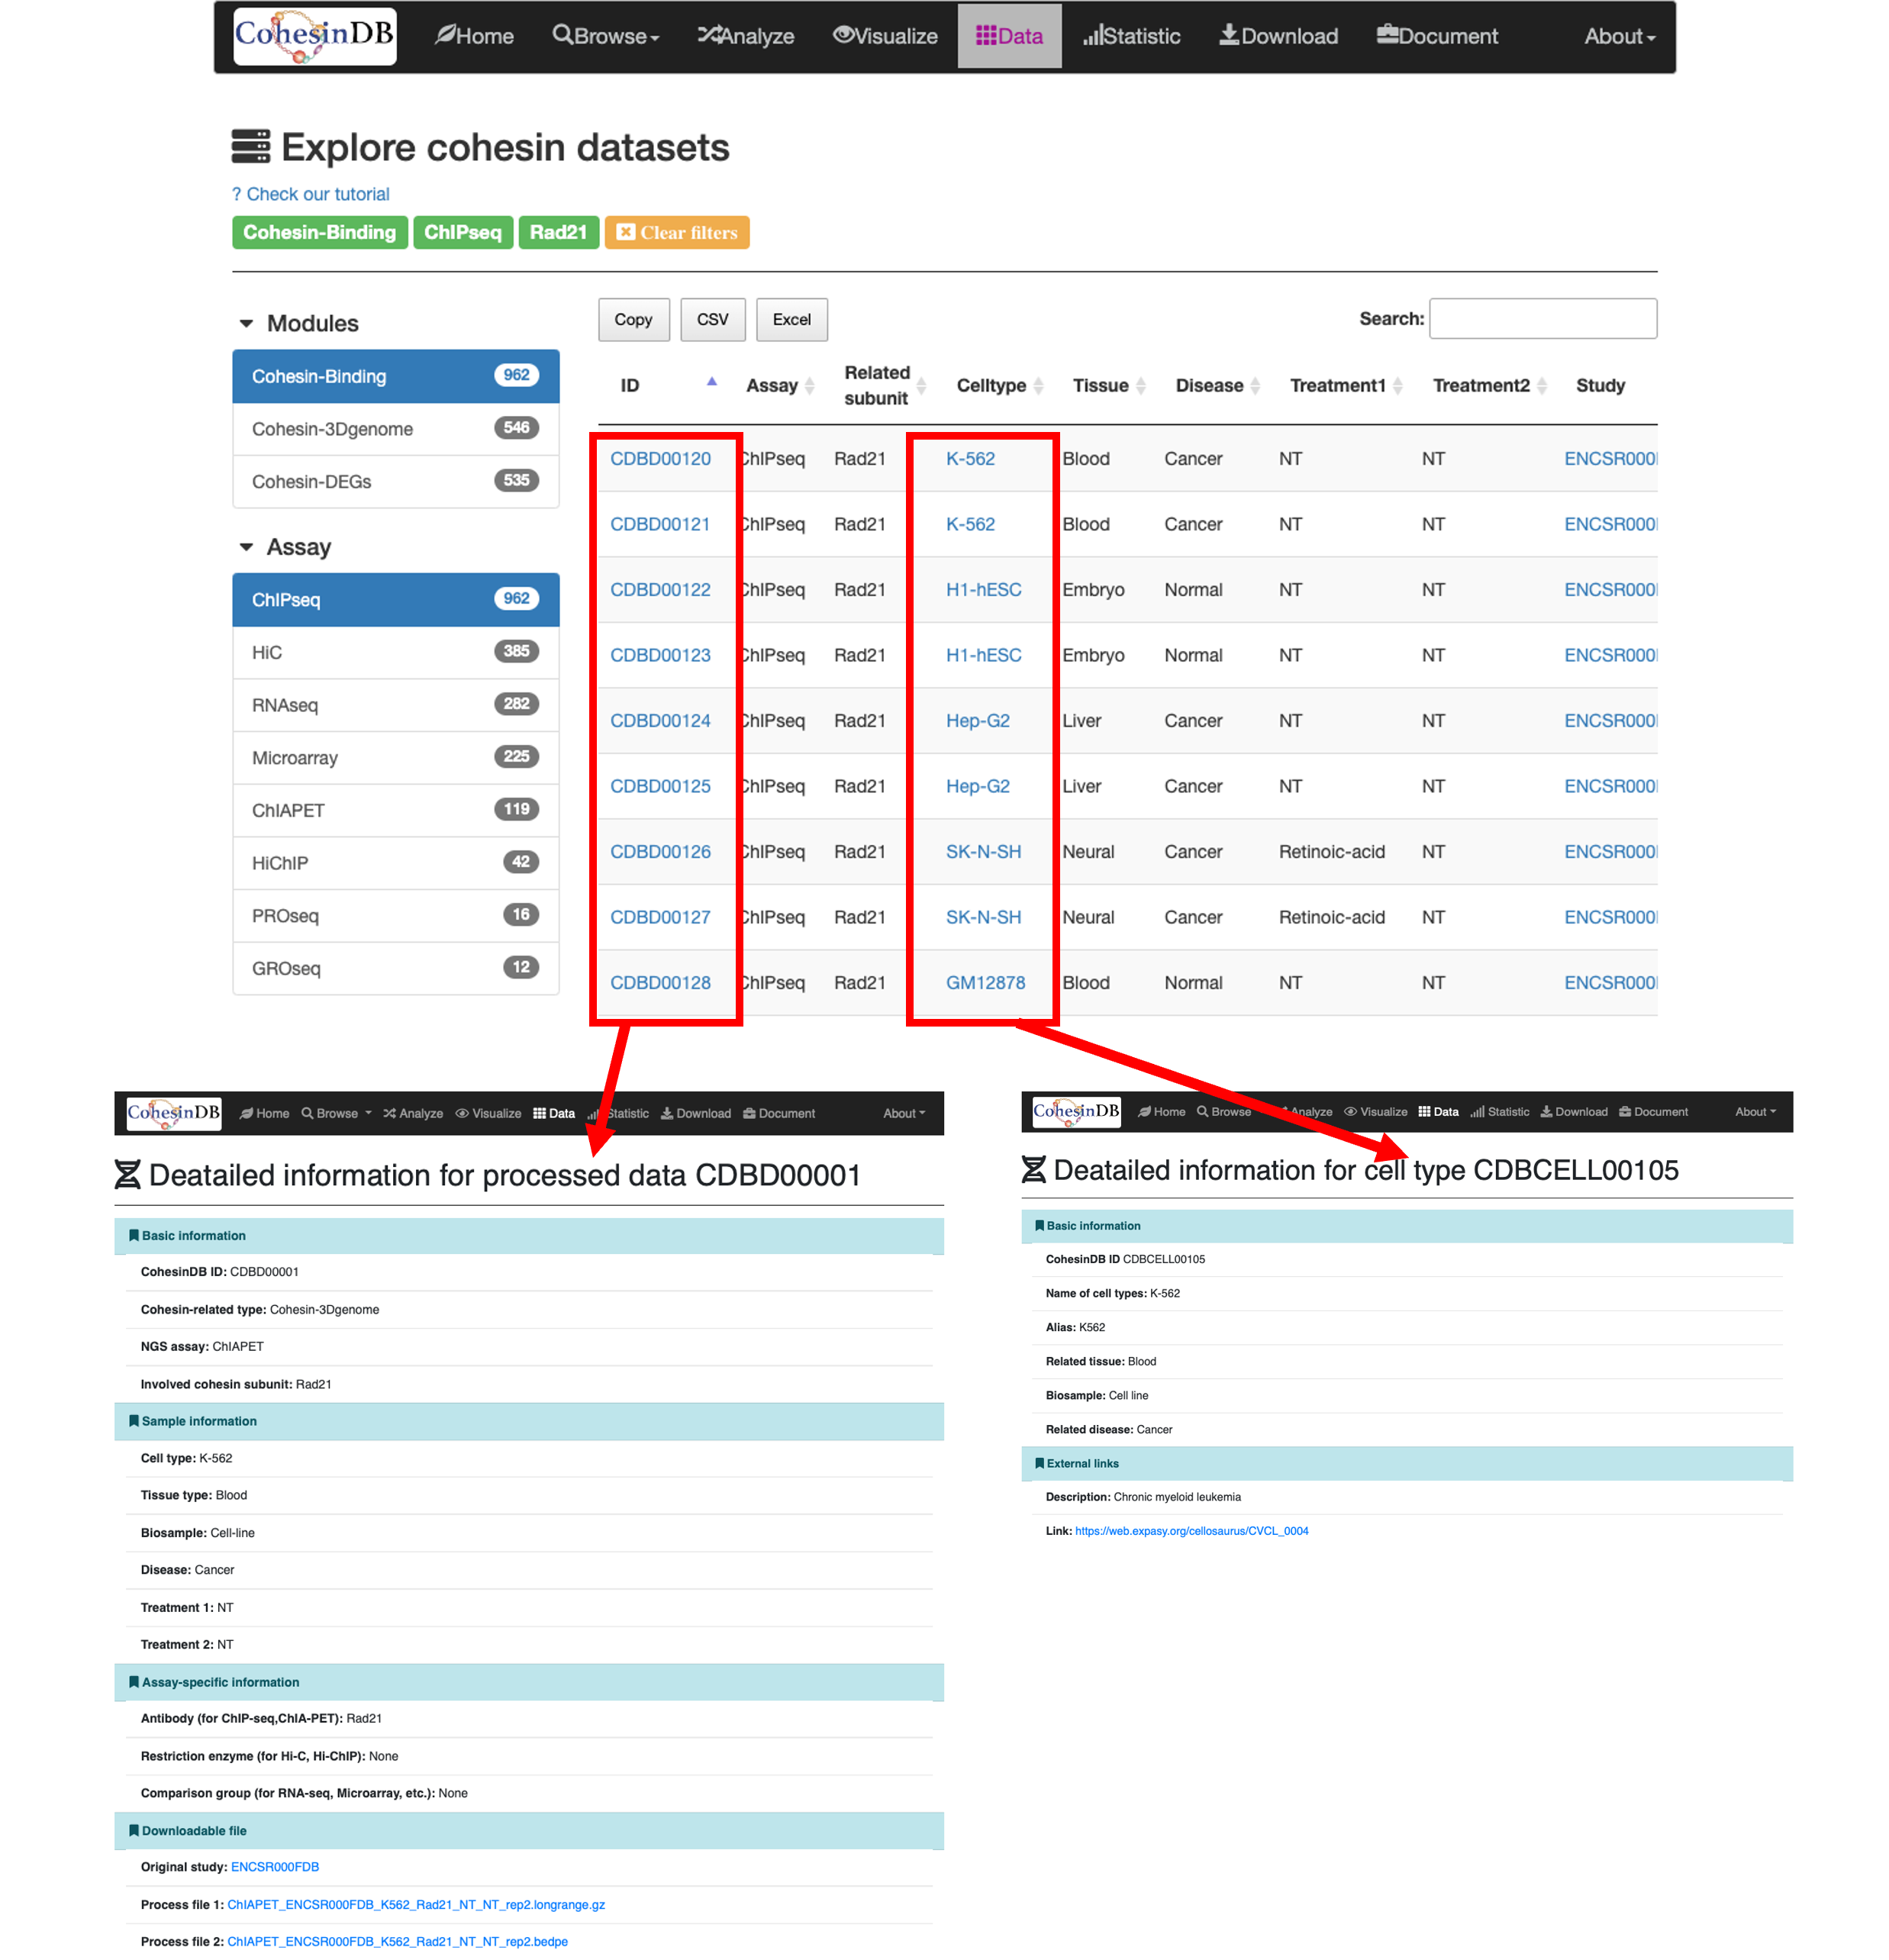
The detailed information for each data include:
Basic information: ID, cohesin-related type, assay type, involved cohesin subunit.
Sample information: Cell type, Tissue type, Biosample, Related disease, Treatment.
Assay-specific information: Antibody, Restriction enzyme, Comparison group.
Downloadable file: Link to the original study, download link.
| Assay | Contents | Format | Format descriptions |
|---|---|---|---|
| ChIP-seq | ChIP-seq reads | .bigwig |
An a popular binary format to represent numerical ChIP-seq reads values over genomic coordinates. Definition and usage can be found in UCSC |
| ChIP-seq | ChIP-seq Peaks | .narrowPeak |
Called peaks of signal enrichement based on normalized data. It is a BED 6+4 format and details can be found here |
| ChIA-PET | Chromatin loops | .longrange |
A bed format-like file type which contains 4 columns from left to right: chromosome, start position, and end position, interaction target. It can be used in WashU Epigenome Browser |
| ChIA-PET | Chromatin loops | .bedpe |
A file format based on the BED format to concisely describe disjointed genomic features such as chromatin loops. Developed by the bedtools team; |
| Hi-C, Hi-ChIP | Hi-C contact matrix | .hic |
An indexed binary format designed to permit fast random access to contact matrix heatmaps. The format was designed by the Juicer |
| Hi-C, Hi-ChIP | Chromatin loops | .bedpe |
A file format based on the BED format to concisely describe disjointed genomic features such as chromatin loops. Developed by the bedtools team; |
| Hi-C | Topologically associated domain | .tad |
It is the similar with bedpe format, which mainly include the genomics loci of the left and right boundaries of TADs. |
| RNA-seq etc. | Differential expressed genes. | tsv |
Results of edgeR. It mainly include the information of logFC and FDR of a gene. |
| RNA-seq etc. | Gene expression (TPM). | tsv |
The results of STAR. It mainly include the TPM and FPKM of a gene. |
Statistic
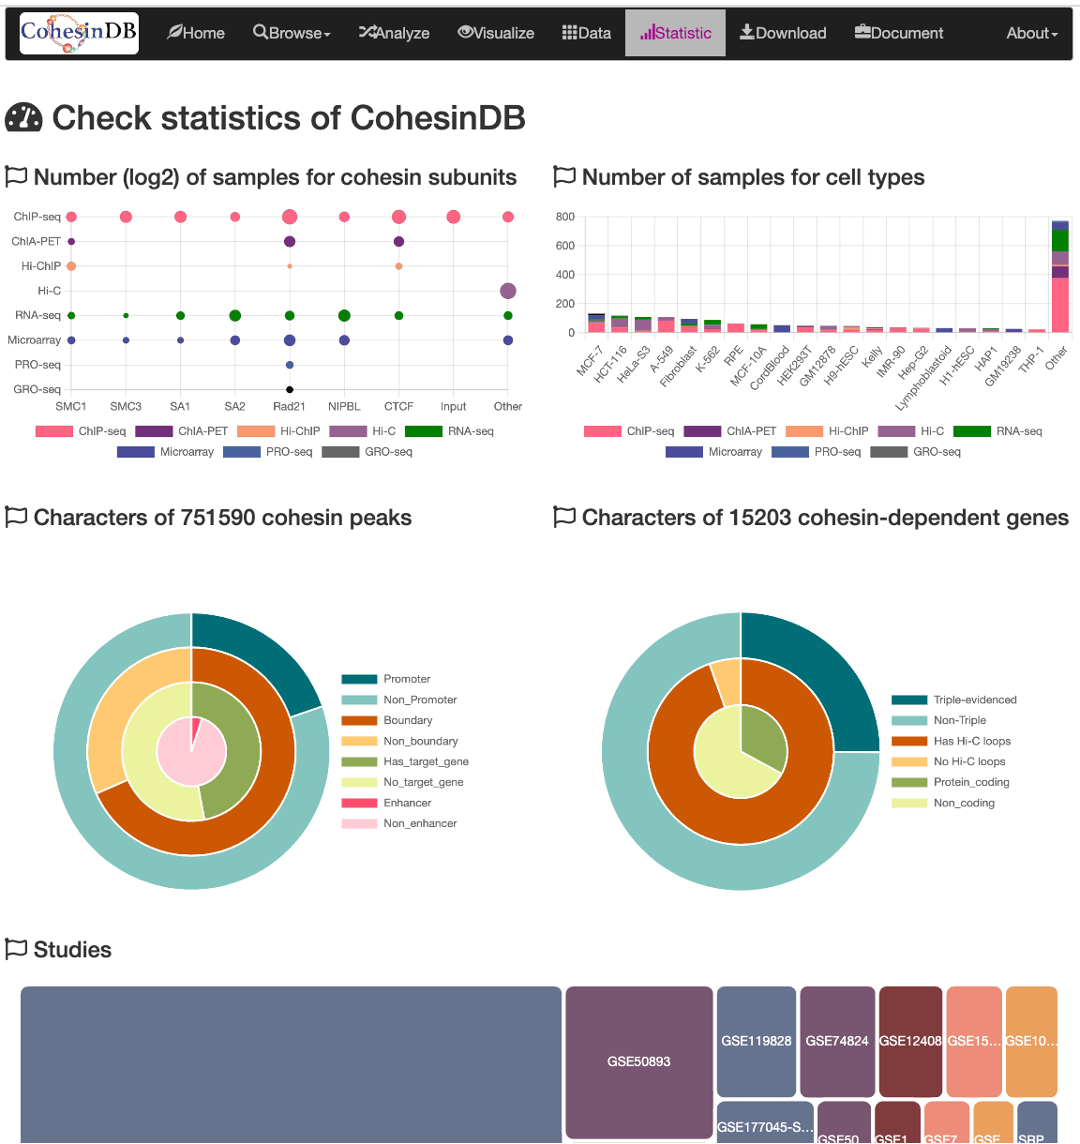
- Number of samples for each cohesin subunit. We used
log2to achieve a better visualization. The majority of them are Rad21, SA1, SMC3. Hi-C samples are assigned to 'Other' because Hi-C provides indirect information for cohesin. Samples with CdLS disease are assigned to NIPBL subunit. - Number of samples for cell types. Overall, the top three cell types are MCF-7, HCT-116 and HeLa cells.
- Information of all cohesin sites. For example, almost all (>96%) cohesin sites also overlap with cohesin ChIA-PET loops, suggesting the reliability of CohesinDB.
- Information of all cohesin-regulated genes. Based on ~2 million cohesin-gene pairs, there are 15203 genes that are regulated by cohesin, with double-evidence.
- Studies included in CohesinDB.
Download
This page provides the downloading of all cohesin-related data, that are collected in CohesinDB. Please note that this page does not contain the processed file for each sample. Please go to Data page for those contents.
The downloadable file include:
All cohesin peaks with annotations: This is a tab-separated file that provides all cohesin binding sites with detailed annotations.
All cohesin-mediated chromatin interactions: This is a tab-separated file that provides all cohesin mediated loops with detailed annotations.
All genes annotated by regulatory cohesin: This is a tab-separated file that provides all cohesin regulated genes with detailed annotations.
All gene-to-cohesin pairs evidenced by cohesin-loops and cohesin DEGs: This is a tab-separated file that provides 'cohesin sites'-to-gene pairs (double-evidenced).
All ChIP-seq peaks at bed3 format: This is a zipped file that includes 550 peak files of cohesin ChIP-seq.